Collecting Efficiency
We continue to work towards implementing a
significant improvement to the Phase II Target Submission Language
parameterization of sky transparency. Instead of requesting N/S/P
conditions (0%/50%/90% transparency), users will soon request a
minimum value of Collecting Efficiency (CE) for their observation,
where:Collecting Efficiency = Sky Transparency * Primary Mirror Pupil Illumination
This will give users more detailed information and control over
their data quality. There is documentation available to describe
how to estimate CE for your targets and what types of values are
reasonable to request: https://hydra.as.utexas.edu/?a=help&h=140
Sky Transparency varies between 0.0 (fully
cloudy) and 1.0 (fully clear) and Pupil Illumination varies
between 0.5 (tracker at extreme edge) and 1.0 (tracker centered
over the mirror), so CE varies from 0.0 to 1.0. Note that we
also provide an online Filling
Factor Calculator to determine the maximum pupil
illumination available for a given declination and exposure
time. Experienced users will be aware that longer exposures
experience worse pupil illumination: at Dec=+45deg, a 10min
exposure has an average pupil of 97% but a 30min exposure has
only 91% pupil illumination. This impact should be considered
carefully when requesting CE in the future!
Beginning in 23-1, all observations reported
on the "Objects Observed" tab on Hydra include the CE for each
exposure. Users are strongly encouraged to use this opportunity
to become familiar with the typical values of CE during regular
observations:
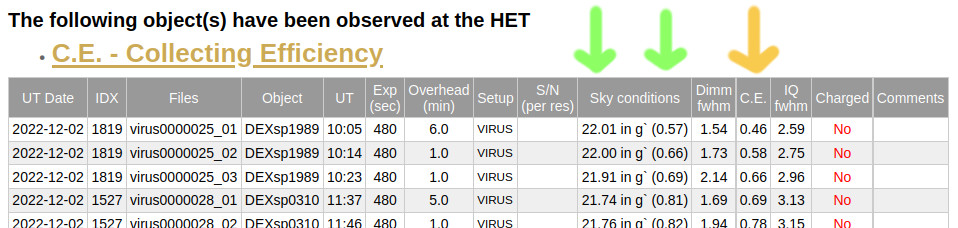
Remember that "Sky conditions" (green arrows above) include the
average sky surface brightness (in the listed SDSS filter)
during your exposure, and the average transparency in
parentheses. The new column for C.E. appears under the orange
arrow in the screenshot above.
Starting in 23-3 we hope to transition to CE
and discontinue the use of SKYTRANS. Additional information will
be forthcoming about this important transition.