HET End-Trimester Report
Third Period of 2021
August 1 - November 30
This report is composed of five sections:
Facility Status
In this section we will discuss the status of the HET facility
and each instrument and any limitation to configurations that
occurred during the period.
- LRS2:
- No significant updates during this trimester
- VIRUS:
- As of August 26th there were 78 spectrographs active on
sky, although not all amplifiers are producing use-able
data. The number of good amplifiers continues to grow with
time.
Probe and instrument availability statistics:
There were a total of 123 nights in the trimester:
LRS2-B
|
LRS2-R
|
VIRUS
|
HPF
|
HPF
LFC
|
HPF
high-prec.
|
Guider 1
|
Guider 2
|
WFS 1
|
WFS 2
|
DIMM
|
123
|
123
|
123
|
113
|
122
|
112
|
123
|
123
|
79
|
123
|
123
|
100%
|
100% |
100% |
92%
|
99%
|
91%
|
100% |
100% |
64%
|
100% |
100% |
Observing Statistics
Commissioning, Engineering, and Guaranteed Time Report
There were 245.5 hours granted in the 21-3 period:
- 15 hours of HPF eng/comm
- 10 hours of VIRUS commissioning
- 10 hours for Image Quality analysis
- 25 hours for Operations engineering
- 8 hours of LRS2 GTO
- 20 hours of HPF GTO
- 157.5 hours of HETDEX GTO (including 7.5h from UT for TESLA)
There were 225.9 hours of eng/comm/GTO used (charged) in the
21-3 period, in the following categories:
- 15.1h of HPF commissioning and engineering
- 9.8h of VIRUS commissioning
- 10.2h of Image Quality analysis
- 4.9h of Operations
- 8.8h of LRS2 GTO
- 19.5h of HPF GTO
- 155.6h of HETDEX GTO (including 7.5h from UT for TESLA)
This was one of our best trimesters in terms of utilization of
Comm/Eng/GTO time, driven by HETDEX achieving 99% completion of
its time allocation.
Month by Month Summary
The following table gives the observing statistics for each
month. Column A gives the fraction of the month that was spent
attempting science (as opposed to engineering or instrument
commissioning). Science time is defined to begin at 18 degree
evening twilight and end at 18 degree morning twilight. Column B
gives the fraction of the possible science time (A) lost due to
weather. The other columns give the amount of remaining science
time (after removing weather losses) not spent attempting
science targets. Please note that the first stack of the night
often occurs before 18 degree twilight.
| Month |
A:
Fraction of the Time that was Possible Science |
B:
Fraction of Total Time Lost due to Weather |
C:
Fraction of Actual Science Time Spent with Shutter Open
|
D:
Fraction of Actual Science Time Lost due to Overhead |
E:
Fraction of Actual Science Time Lost due to Alignment |
F:
Fraction of Actual Science Time Lost due to Problems |
G:
Fraction of Actual Science Time Not accounted for or
Lost |
| Aug |
0.963
|
0.510
|
0.666
|
0.282
|
0.0455
|
0.0065
|
0.0000
|
Sep
|
0.944
|
0.391
|
0.644
|
0.286
|
0.0273
|
0.0426
|
0.0000
|
Oct
|
0.955
|
0.220
|
0.682
|
0.265
|
0.0176
|
0.0362
|
0.0000
|
Nov
|
0.986
|
0.389
|
0.671
|
0.252
|
0.0322
|
0.0456
|
0.0000
|
The following tables give a break
down of all attempted science visits as well as the category
that each falls into.
| Charged exposures |
| Number of Times |
Shutter Open (Hours) |
Type |
3635
|
526.80
|
A -
Acceptable |
59
|
14.70
|
B -
Acceptable but Border line conditions |
470
|
129.23
|
4 -
Priority 4 visits (does not include 1/2 charge) |
0
|
0.0 |
Q -
charged but PI error |
| 0 |
0.0 |
C -
Acceptable by RA but PI rejects |
| Uncharged exposures caught by RA |
| Number of Times |
Shutter Open (Hours) |
Type |
0
|
0.00
|
N - Rejected due to unknown
cause |
23
|
4.82
|
E - Rejected for Equipment
Failure |
228
|
52.77
|
W - Rejected for Weather |
27
|
6.03
|
H - Rejected for Human
Errors
|
| Uncharged exposures caught by PI |
| Number of Times |
Shutter Open (Hours) |
Type |
15
|
4.45
|
P - Rejected for weather |
0
|
0.00 |
F - Rejected for Equipment
Failure |
4
|
0.95 |
T - Rejected for poor track
choice |
0
|
0.00 |
X - Rejected for Human
failure |
| Acceptable but Uncharged
exposures |
| Number of Times |
Shutter Open (Hours) |
Type |
0
|
0.0 |
I -
Targets observed under otherwise idle conditions |
The following setup statistics include slew, acquisition, and
starting data collection script. The table below gives the average
setup time for each instrument PER ACTUAL VISIT and the average
and maximum COMPLETED charged science exposures and
visits.
The "Exposure" is defined by when the (CCD) shutter opens and
closes. A "Visit" is the requested total CCD shutter open time
during a track and might be made up of several "Exposures".
"Visit" as defined here contains no overhead. To calculate one
type of observing efficiency metric one might divide the "Visit"
by the sum of "Visit" + "Overhead".
The average setup per visit is calculated from acceptable
priority 0-3 (not borderline) science targets. This number
reflects how quickly we can move from object to object on average
for each instrument, however, this statistic tends to weight the
setup for programs with large number of targets.
The average overhead percentage is calculated for each instrument
and shows how much of that instrument's total time on sky
(overhead+exposure) was overhead. NB: LRS2 has the smallest
overhead %, but typical LRS2 observations use much longer
exposures than VIRUS, even though VIRUS has a faster average setup
time.
| Instrument |
Avg Setup per Visit
(min) |
Total time exposed
(hrs) |
Overhead
% |
| VIRUS |
4.48
|
133.45
|
24.80% |
| LRS2 |
5.79
|
98.40
|
29.49%
|
| HPF |
6.81
|
214.27
|
30.68%
|
The setup statistics can be shortened by multiple setups (each
one counted as a separate visit) while on the same target such as
moving from LRS2-B to LRS2-R.
HETDEX time interruptions:
Within the times when HETDEX shots were available on-sky for
>20 minutes, the following percentages summarize how the time
was used:
- 46.7% HETDEX (36.6% exposures, 10.1% overhead)
- 30.9% weather losses
- 19.2% sci/GTO/eng/comm (1.44% engineering/commissioning, 11.4%
science/GTO exposures, 6.35% science/GTO overheads)
- 32.2% at P0 (17.1h)
- 19.9% at P1 (10.6h)
- 10.1% at P2 (5.4h)
- 16.6% at P3 (8.8h)
- 21.2% at P4 (11.3h)
- 1.3% mirror alignment
- 1.9% problems
Overall time charged: 225.9 (eng/comm/GTO) + 394.17h (sci) =
620.07h
Total estimated science time available (in TAC time
determinations): 609.54h
Conclusion: weather in 21-3 was slightly better than
expected, resulting in high completion rates across
programs/priorities.
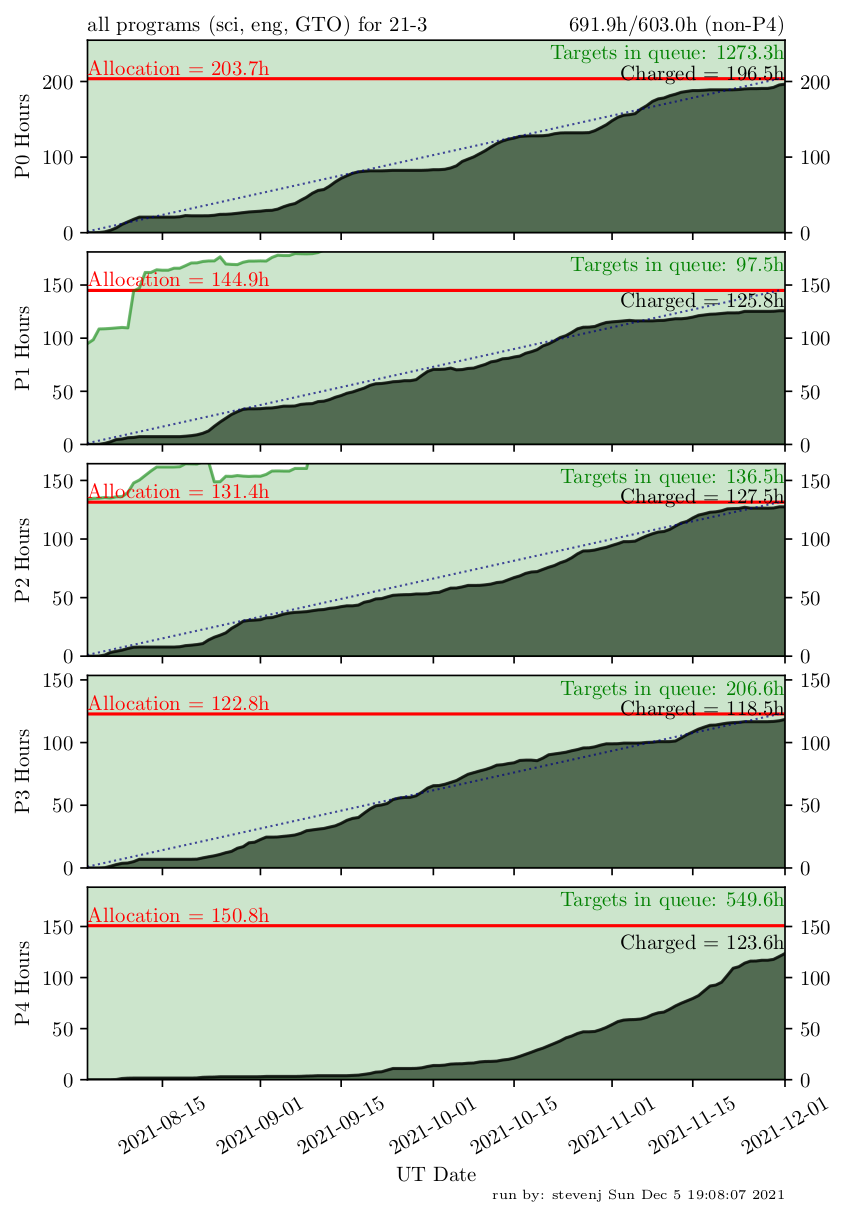
Observing Programs Status
In the table below we show the breakdown of the charged time for
each program submitted. The "Total %" is the completion of the
entire TAC time including P4 time. The last four columns show the
completion rate for targets submitted in each priority bin. This
completion rate is the greater of the targets completed percentage
and the TAC allocation completed percentage in each priority bin.
| Institution |
Tot exp
|
Tot OH
|
Tot Chrg |
Tot TAC |
Total % |
P0 Completion
|
P1 Completion |
P2 Completion |
P3 Completion |
|
|
|
|
|
|
|
|
|
|
| G21-3-001 |
0.21
|
0.10
|
0.31
|
0.33
|
94%
|
|
|
100% |
|
| G21-3-002 |
11.20
|
3.20
|
14.40
|
13.77
|
105%
|
100%
|
100%
|
100% |
100%
|
|
|
|
|
|
|
|
|
|
|
| M21-3-001 |
7.31
|
2.68
|
9.99
|
7.60
|
131%
|
100%
|
100%
|
100%
|
100%
|
| M21-3-002 |
2.92
|
0.90
|
3.82
|
4.00
|
95%
|
|
100%
|
100%
|
|
| M21-3-003 |
3.26
|
1.53
|
4.79
|
7.20
|
67%
|
|
100%
|
100%
|
22% (HC)
|
| M21-3-004 |
1.65
|
0.50
|
2.15
|
2.00
|
108%
|
100%
|
|
|
|
|
|
|
|
|
|
|
|
|
|
| PSU21-3-001 |
2.58
|
0.63
|
3.22
|
7.87
|
41%(P4)
|
|
100% |
100%
|
100%
|
| PSU21-3-002 |
0.09
|
0.13
|
0.22
|
0.26 |
83%
|
|
100%
|
|
|
| PSU21-3-003 |
5.81
|
0.00
|
5.81
|
6.33
|
92%(P4)
|
|
|
|
|
| PSU21-3-004 |
6.30
|
2.11
|
8.41
|
8.53
|
99%
|
100%
|
100%
|
100%
|
100%
|
| PSU21-3-005 |
3.68
|
0.93
|
4.61
|
5.05
|
91%
|
|
|
|
100%
|
| PSU21-3-006 |
1.25
|
0.00
|
1.25
|
1.33
|
94%(P4)
|
|
|
|
|
| PSU21-3-007 |
J*
|
J* |
J* |
J* |
J* |
|
J*
|
J*
|
J*
|
| PSU21-3-008 |
J*
|
J*
|
J*
|
J*
|
J*
|
|
J*
|
J*
|
J*
|
| PSU21-3-009 |
5.36
|
1.34 |
6.70 |
6.67 |
100% |
100%
|
100% |
100% |
|
| PSU21-3-010 |
2.63
|
0.32
|
2.95
|
3.68
|
80%(P4)
|
|
|
|
100%
|
| PSU21-3-011 |
31.98
|
7.91
|
39.90
|
40.00
|
100%
|
100%
|
100%
|
100%
|
100%
|
| PSU21-3-012 |
0.50
|
0.13
|
0.63
|
1.33
|
48%
|
|
100%
|
|
|
|
|
|
|
|
|
|
|
|
|
| UT21-3-001 |
8.50
|
1.27
|
9.77
|
13.90
|
70%
|
|
100%
|
94%
|
|
| UT21-3-002 |
12.15
|
2.16
|
14.31
|
15.33
|
93%(P4)
|
100%
|
100%
|
100%
|
|
| UT21-3-003 |
2.08
|
0.98
|
3.05
|
4.60
|
67%
|
|
|
67% (SI)
|
|
| UT21-3-004 |
J*
|
J*
|
J*
|
J*
|
J*
|
|
J*
|
J*
|
J*
|
| UT21-3-005 |
22.14
|
6.50
|
28.64
|
47.70
|
60%(P4)
|
98%
|
100%
|
100%
|
100%
|
| UT21-3-006 |
15.93
|
7.58
|
23.51
|
33.90
|
69%(P4)
|
|
100%
|
|
89%
|
| UT21-3-007 |
10.69
|
7.68
|
18.37
|
45.00
|
41%(P4)
|
|
|
|
99%
|
| UT21-3-008 |
11.51
|
7.72
|
19.24
|
28.60
|
67%(P4)
|
|
|
100%
|
100%
|
| UT21-3-010 |
38.15
|
5.95
|
44.10
|
50.0
|
88%(P4)
|
|
|
|
100%
|
| UT21-3-011 |
7.08
|
1.75
|
8.83
|
13.00
|
68%(P4)
|
|
100%
|
|
|
| UT21-3-013 |
6.67
|
1.15
|
7.82
|
7.30
|
107%
|
|
100%
|
100%
|
|
| UT21-3-014 |
8.60
|
5.44
|
14.04
|
24.00
|
58%(P4)
|
|
|
100%
|
100%
|
| UT21-3-015 |
2.50
|
1.18
|
3.68
|
3.30
|
111%
|
|
100%
|
|
|
| UT21-3-016 |
2.00
|
0.43
|
2.43
|
2.50
|
97%
|
100%
|
100%
|
|
|
| UT21-3-017 |
3.44
|
1.17
|
4.62
|
5.00
|
92%
|
|
100%
|
100%
|
|
| UT21-3-018 |
6.42
|
1.95
|
8.37
|
8.00
|
105%
|
|
|
100%
|
|
| UT21-3-019 |
0.42
|
0.08
|
0.50
|
0.50
|
100%
|
100%
|
|
|
|
|
|
|
|
|
|
|
|
|
|
| HET21-3-100 |
118.25
|
37.35
|
155.6
|
157.5
|
99%
|
99%
|
|
|
|
| HET21-3-201 |
6.22
|
1.29
|
7.52
|
9.50
|
79%(P4)
|
|
100%
|
100%
|
100%
|
| HET21-3-203 |
0.92
|
0.18
|
1.10
|
4.00
|
28%(P4)
|
100%
|
|
|
100%
|
| HET21-3-205 |
2.33
|
0.57
|
2.90
|
5.50
|
53%(P4)
|
|
|
|
100%
|
| HET21-3-300 |
15.40
|
4.13
|
19.53
|
20.00
|
98%
|
100%
|
100%
|
100%
|
|
|
|
|
|
|
|
|
|
|
|
Joint prog:
UT21-3-004
PSU21-3-007
PSU21-3-008 |
63.05
|
10.85
|
73.89
|
78.68
|
94%(P4)
|
|
100%
|
100%
|
100%
|
|
|
|
|
|
|
|
|
|
|
J* = joint program between UT, PSU, and Munich - see summary
at bottom of table
NT = no (or very late-in-trimester) targets submitted
at this priority (even though time was allocated)
HC = HETDEX conflict (targets submitted were in
direct competition with HETDEX; PI was aware of issue)
SI = Seasonally inappropriate (target had limited
availability during trimester because of twilights)
TD = Time Domain targets (either none submitted or
submitted targets unreachable due to weather)
P4 = Program's overall completion fraction is significantly
impacted by the utilization of P4 time
Program Completion Rates
(sci only, removing NT/HC/TD) |
| Priority |
Average Completion |
Median Completion |
| P0 |
99.8% |
100% |
| P1 |
100% |
100% |
| P2 |
98.1% |
100% |
| P3 |
95.0% |
100% |
NB great weather in the second half of the 21-3 trimester
resulted in high completion rates for all priorities.
Completion trends by
priority
Institution Status
Below we show how the TAC allocations were
determined.
quantity
|
Aug
(hrs)
|
Sep
(hrs)
|
Oct
(hrs)
|
Nov
(hrs)
|
Total
(hrs)
|
18deg-18deg
|
243.93
|
268.10
|
306.58
|
318.17
|
1136.78
|
| Weather loss frac. |
0.432
|
0.513
|
0.391
|
0.369
|
|
Efficiency loss frac.
(align+PRs)
|
0.08
|
0.07
|
0.07
|
0.07
|
|
"Clear science" time
|
127.47
|
121.43
|
173.64
|
187.01
|
609.54
|
Com/Eng/GTO time
|
|
|
|
|
245.50
|
"Allowed" hours
given to TACs
for science
|
|
|
|
|
364.04
|
Partner
|
Share
|
Notes
|
Total hours
allowed
|
Goettingen
|
0.03860
|
|
14.05
|
Munich
|
0.05724
|
|
20.84
|
PSU
|
0.24897
|
|
90.64
|
UT
|
0.65518
|
-7.5h TESLA allocation
per HET Board
|
231.01
|
TACs may allocate up to 8.3% at P0, 25% at P1, 33.3% at P2 and
33.3% at P3. P4 allocations are not restricted. GTO and
engineering time are assigned by the HET board and not from this
formula.
This is how each institution had
allocated its time by priority:
| Time Allocation by Institution (hours) |
|
|
| Institution |
Priority 0 |
Priority 1 |
Priority 2 |
Priority 3 |
Priority 4 |
Total P0-P3
|
Frac. of allowed
|
| Goettingen
|
1.20
|
3.50
|
4.70
|
4.70
|
-
|
14.10
|
100.4%
|
| Munich
|
1.70
|
5.30
|
6.90
|
6.90
|
-
|
20.80
|
99.8%
|
| PSU
|
6.60
|
21.33
|
30.50
|
30.50
|
14.80
|
88.93
|
98.1%
|
| UT
|
19.75
|
57.80
|
76.33
|
77.75
|
127.00
|
231.63
|
100.3%
|
| Other allocations |
| GTO
|
163.5 |
13.00 |
8.00 |
3.00
|
9.00
|
187.50
|
100.0%
|
Notes:
1) Allocations in joint programs are reported separately for each
partner
The following is a summary of the total charged time for each
institution based on our htopx data base (for shutter open) and
night reports (for overhead). It includes shutter open time
(weighting priority four by half) and overhead (no overhead for
priority 4 observations). Recently this calculation was
re-derived using a deficit/surplus model. For each financial
year the share paid is compared with the time charged - any
discrepancy between the two is tracked and carried forward as a
deficit. A negative deficit means more time was observed for
that partner than their financial share; a positive deficit
means less time was observed. These deficits are calculated in
each previous financial year; the table below also includes a
preliminary total for the current financial year so far.
Accumulated deficits
for each partner
|
|
UT
|
PSU
|
M
|
G
|
total sci
hours
|
FY2015-2016
|
|
+4.6
|
-6.9
|
+1.1
|
+1.2
|
40.49
|
FY2016-2017
|
|
+22.7
|
-22.8
|
+0.8
|
-0.8
|
439.56
|
FY2017-2018
|
|
+37.7
|
-21.9
|
-14.7
|
-1.2
|
887.71
|
FY2018-2019
|
|
+43.0
|
-32.0
|
-10.8
|
-0.2
|
1401.17
|
FY2019-2020
|
|
+48.9
|
-48.4
|
+0.6
|
-1.1
|
2101.82
|
|
FY2020-2021
|
|
+25.1
|
-37.6
|
+13.8
|
-1.3
|
3095.70
|
|
FY2021-2022
(as of 1 Dec 2021)
|
|
+18.4
|
-34.0
|
+16.0
|
-0.5
|
3497.30
|
*Note that UT's deficit is decreasing and total deficits are <1%
of total science hours.
NB: a more comprehensive annual partner fractional time charging
analysis is produced separately from these trimester reports; a
current copy can be provided upon request.
Below are the summaries of the Guaranteed
Time Observations (GTO) programs granted by the Board:
| GTO and Special Time Charged by Project
(hours) |
| Project |
Allocated
in 21-3 |
Allocated total
to date
including 21-3 |
Charged
in 21-3 |
Charged total
to date
including 21-3 |
| HETDEX (HETYY-P-100) |
150.0 |
2314.0 |
148.1 |
1698.9 |
| LRS2 GTO (HETYY-P-2XX) |
8.0 |
183.9 |
8.8 |
109.9 |
| HPF GTO (HETYY-P-3XX) |
20.0 |
200.4 |
19.5
|
200.6 |
| GW (HETYY-P-400) |
0.0 |
70.0
|
0.0
|
12.4 |
(Totals to date start from the 11-2 period)
SJ, 5 Dec 2021