In this section we will discuss the status of the HET facility
and each instrument and any limitation to configurations that
occurred during the period.
A Note to HPF Users from Suvrath and the HPF team:
On November 23rd the temperature of the HPF cold finger inside the instrument showed a sudden jump, with the cold finger warming up a fraction of a degree. The jump corresponds to a real change in the internal physical configuration of the HPF instrument- ie. it is not just a faulty sensor. Corresponding to this jump in the cold finger, the HPF bench immediately started to cool, with exponential decay, and has now cooled by almost 50milliKelvin, with the bench temperatures settling now. With HPF's typical stability at the millikelvin or sub millikelvin level, this is a sudden and steep change to normal operations. A jump in the output power of the wall heater closest to the cold finger has also been detected, temporally coincident with the jump in the cold finger temperature. The preferred hypothesis of the HPF team is that something physically changed that is now more strongly coupling the cold finger to the rest of the instrument. For example, a tear, or slip in the MLI covering the cold finger that leads to enhanced radiative coupling, or a physical contact that did not exist before. Such an event has not happened in HPF before, in its multi-year operations.
Approximately a week before this temperature transient occurred an earthquake was felt at the HET. The proximity of these events is suspicious, and tempting to attribute causality to. But no direct physical evidence yet exists in hand to definitively link these events. It is the HPF's team's current thinking that this is quite concerning, but does not yet rise to the level of needing an intrusive multimonth instrument takedown, and does not currently seem to be threatening the instrument itself. If temperatures settle and stabilize, HPF stability, with calibration, should be similar to before. The transient and large nature of this event though means that calibration is unlikely to work perfectly for some days after the event started. We have not looked at the on-sky velocities pre and post this event yet, so there remains the possibility that the event may cause an uncalibrated jump in the RVs, especially in cases where simultaneous calibration is not used, and the processing relies on the underlying smoothness and stability of the HPF drifts. This event breaches the assumptions of slow drifts and smoothness built into the HPF drift models in the HPF pipeline.
In summary- we have a plausible physical explanation of what might have happened, that fits all the available telemetry data, but not incontrovertible proof. A detailed root-cause analysis of this event is therefore not currently envisioned, since this will require intrusive instrument takedown, and a concomitant loss of astrophysics. Monitoring of this situation is ongoing.
| LRS2-B |
LRS2-R |
VIRUS |
HPF |
HPF LFC |
HPF high-prec. |
Guider 1 |
Guider 2 |
WFS 1 |
WFS 2 |
DIMM |
| 123 |
123 |
123 |
123 |
123 |
120 |
119 |
119 |
111 |
115 |
123 |
| 100% |
100% | 100% | 100% |
100% |
98% |
97% | 97% | 90% |
93% | 100% |
Commissioning, Engineering, and Guaranteed Time Report
There were 224 hours granted in the 22-3 period:
There were 185.2 hours of eng/comm/GTO used (charged)
in the 22-3 period, in the following categories:
Month by Month Summary
The following table gives the observing statistics for each month. Column A gives the fraction of the month that was spent attempting science (as opposed to engineering or instrument commissioning). Science time is defined to begin at 18 degree evening twilight and end at 18 degree morning twilight. Column B gives the fraction of the possible science time (A) lost due to weather. The other columns give the amount of remaining science time (after removing weather losses) not spent attempting science targets. Please note that the first stack of the night often occurs before 18 degree twilight.
| Month | A: Fraction of the Time that was Possible Science |
B: Fraction of Total Time Lost due to Weather |
C: Fraction of Actual Science Time Spent with Shutter Open |
D: Fraction of Actual Science Time Lost due to Overhead |
E: Fraction of Actual Science Time Lost due to Alignment |
F: Fraction of Actual Science Time Lost due to Problems |
G: Fraction of Actual Science Time Not accounted for or Lost |
|---|---|---|---|---|---|---|---|
| Aug |
0.846 |
0.576 |
0.565 |
0.226 |
0.0939 |
0.1150 |
0.0000 |
| Sep |
0.984 |
0.332 |
0.649 |
0.251 |
0.0447 |
0.0549 |
0.0000 |
| Oct | 0.991 |
0.466 |
0.648 |
0.250 |
0.0662 |
0.0351 |
0.0000 |
| Nov |
0.986 |
0.506 |
0.621 |
0.256 |
0.0747 |
0.0483 |
0.0000 |
The following tables give a break down of all attempted science visits as well as the category that each falls into.
| Charged exposures | ||
|---|---|---|
| Number of Times | Shutter Open (Hours) | Type |
| 3471 |
463.85 |
A - Acceptable |
| 131 |
27.02 |
B - Acceptable but Border line conditions |
| 122 |
25.78 |
4 - Priority 4 visits (does not include 1/2 charge) |
| 0 |
0.0 | Q - charged but PI error |
| 0 | 0.0 | C - Acceptable by RA but PI rejects |
| Uncharged exposures caught by RA | ||
|---|---|---|
| Number of Times | Shutter Open (Hours) | Type |
| 2 |
0.58 |
N - Rejected due to unknown cause |
| 53 |
8.58 |
E - Rejected for Equipment Failure |
| 365 |
74.42 |
W - Rejected for Weather |
| 9 |
2.80 |
H - Rejected for Human
Errors |
| Uncharged exposures caught by PI | ||
|---|---|---|
| Number of Times | Shutter Open (Hours) | Type |
| 4 |
1.33 |
P - Rejected for weather |
| 6 |
2.47 | F - Rejected for Equipment Failure |
| 0 |
0.00 | T - Rejected for poor track choice |
| 0 |
0.00 | X - Rejected for Human Errors |
| Acceptable but Uncharged exposures | ||
|---|---|---|
| Number of Times | Shutter Open (Hours) | Type |
| 0 |
0.0 | I - Targets observed under otherwise idle conditions |
The following setup statistics include slew, acquisition, and starting data collection script. The table below gives the average setup time for each instrument PER ACTUAL VISIT and the average and maximum COMPLETED charged science exposures and visits.
The "Exposure" is defined by when the (CCD) shutter opens and closes. A "Visit" is the requested total CCD shutter open time during a track and might be made up of several "Exposures". "Visit" as defined here contains no overhead. To calculate one type of observing efficiency metric one might divide the "Visit" by the sum of "Visit" + "Overhead".
The average setup per visit is calculated from acceptable
priority 0-3 (not borderline) science targets. This number
reflects how quickly we can move from object to object on average
for each instrument, however, this statistic tends to weight the
setup for programs with large number of targets.
The average overhead percentage is calculated for each instrument
and shows how much of that instrument's total time on sky
(overhead+exposure) was overhead. NB: LRS2 has the smallest
overhead %, but typical LRS2 observations use much longer
exposures than VIRUS, even though VIRUS has a faster average setup
time.
| Instrument | Avg Setup per Visit (min) |
Total time exposed (hrs) |
Overhead % |
|---|---|---|---|
| VIRUS | 4.59 |
114.48 |
41.52% |
| LRS2 | 6.17 |
64.33 |
33.47% |
| HPF | 6.55 |
176.92 |
28.02% |
The setup statistics can be shortened by multiple setups (each
one counted as a separate visit) while on the same target such as
moving from LRS2-B to LRS2-R.
Within the times when HETDEX shots were available on-sky for >20 minutes, the following percentages summarize how the time was used:
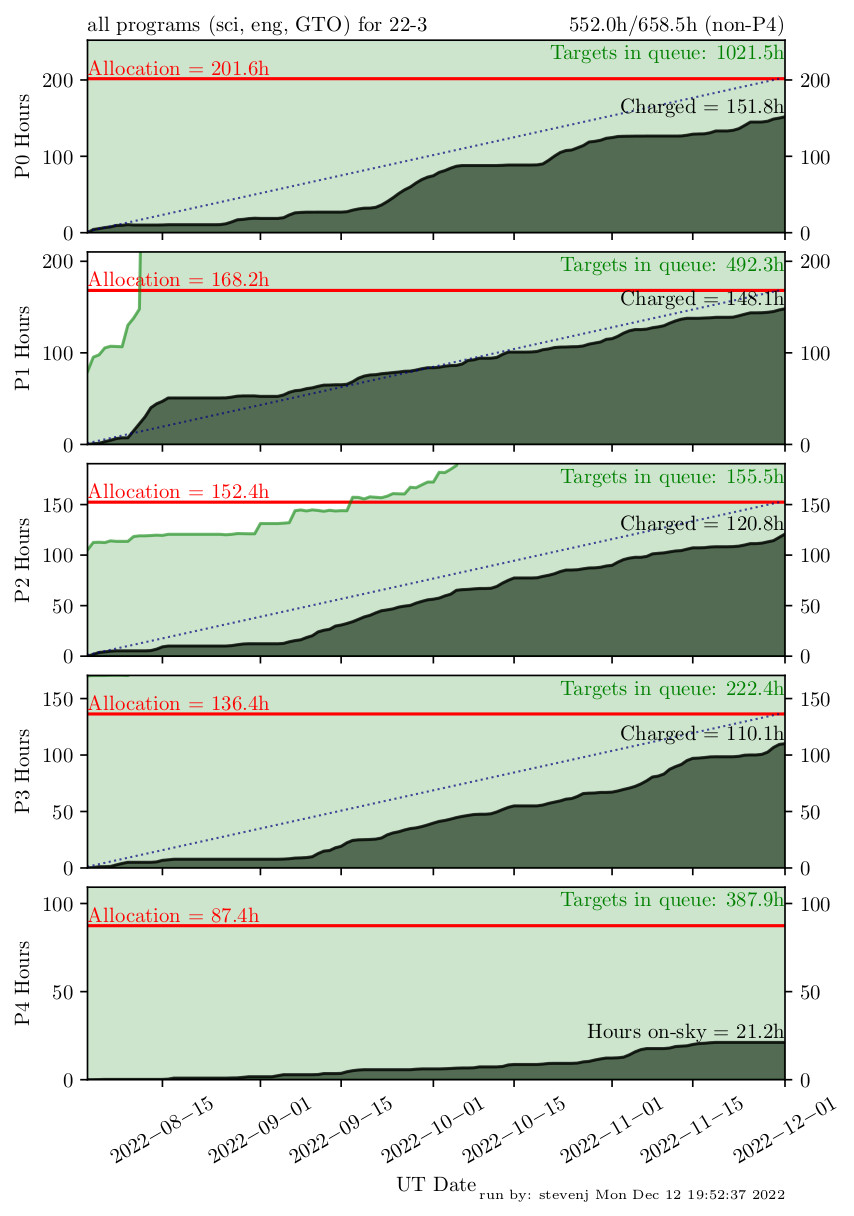
Overall time charged: 185.2 (eng/comm/GTO) + 356.7h (sci) = 541.9h
Total estimated science time available (in TAC time
determinations): 624.2h
Conclusion: weather in 22-3 was much worse than
expectations...
The past two 3rd trimesters charged
times were 620.8h and 707.3h, so this one had exceptionally poor
weather
In the table below we show the breakdown of the charged time for
each program submitted. The "Total %" is the completion of the
entire TAC time including P4 time. The last four columns show the
completion rate for targets submitted in each priority bin. This
completion rate is the greater of the targets completed percentage
and the TAC allocation completed percentage in each priority bin.
| Institution | Tot exp |
Tot OH |
Tot Chrg | Tot TAC | Total % | P0 Completion |
P1 Completion | P2 Completion | P3 Completion |
|---|---|---|---|---|---|---|---|---|---|
| |
|||||||||
| G22-3-001 | 0.22 |
0.10 |
0.32 |
0.33 |
96% |
100% | |||
| G22-3-002 | 10.50 |
2.53 |
13.03 |
15.27 |
85% |
100% |
100% |
100% | 63% |
| M22-3-001 | 0.82 |
0.17 | 0.98 |
7.00 |
14% |
35% |
0% (SI) |
|
|
| M22-3-002 | 2.25 |
0.68 |
2.93 |
6.00 |
49% |
100% |
55% |
0% (SI) |
|
| M22-3-003 | 1.47 |
0.43 |
1.90 |
2.00 |
95% |
100% |
|||
| M22-3-004 | 11.25 |
6.08 |
17.33 |
17.20 |
101% |
100% |
100% |
||
| PSU22-3-001 | 0.71 |
0.00 |
0.71 |
1.33 |
53%(P4) |
100% |
|||
| PSU22-3-002 | 1.97 |
0.50 |
2.47 |
3.65 |
68% |
100% |
33% |
||
| PSU22-3-003 | 3.83 | 1.48 |
5.32 | 5.20 | 102% |
100% |
100% |
||
| PSU22-3-004 | 13.39 |
3.30 |
16.68 |
22.39 |
75%(P4) |
100% |
91% |
||
| PSU22-3-005 | 0.09 |
0.13 |
0.22 |
0.26 |
83% |
100% |
|||
| PSU22-3-006 | 0.68 |
0.00 |
0.68 |
6.33 |
11%(P4) |
||||
| PSU22-3-007 | 1.50 |
0.37 | 1.87 | 3.62 |
52% | 52% |
|||
| PSU22-3-008 | J* |
J* | J* | J* | J* | J* | J* | J* | J* |
| PSU22-3-009 | 7.56 |
1.75 | 9.32 | 10.67 |
87% | 81% |
91% |
||
| PSU22-3-010 | 32.03 |
8.04 |
40.07 |
39.99 |
100% |
100% |
100% |
100% |
100% |
| PSU22-3-011 | 0.00 |
0.00 |
0.00 |
0.00 |
0% |
0% (TD) |
|||
| UT22-3-001 | 9.34 |
3.73 |
13.07 |
16.00 |
82% |
100% |
100% |
||
| UT22-3-002 | 5.83 |
1.18 |
7.02 |
12.50 |
56%(P4) |
86% (TD) |
71% (TD) |
||
| UT22-3-003 | 15.30 |
8.25 |
23.55 |
35.90 |
66%(P4) |
93% |
76% |
||
| UT22-3-004 | 3.83 | 1.08 |
4.92 |
5.50 |
89% |
89% (DT) |
|||
| UT22-3-005 | 4.67 |
0.88 |
5.55 |
7.30 |
76% |
100% |
75% |
||
| UT22-3-006 | 6.50 |
3.38 |
9.88 |
14.00 |
71% |
89% |
63% |
||
| UT22-3-007 | 7.30 |
2.40 |
9.70 |
10.00 |
97% |
93% (DT) |
100% |
||
| UT22-3-008 | J* |
J* | J* | J* | J* | J* | J* | J* | J* |
| UT22-3-009 | 13.90 |
9.14 |
23.04 |
35.00 |
66%(P4) |
93% |
100% |
95% |
78% |
| UT22-3-010 | 9.97 |
8.82 |
18.78 |
39.00 |
48%(P4) |
96% |
61% |
||
| UT22-3-011 | 4.83 |
1.03 |
5.87 |
5.00 |
117% |
100% |
|||
| UT22-3-012 | 3.19 |
0.51 |
3.70 |
22.00 |
17%(P4) |
75% |
0% (DT) |
||
| UT22-3-013 | 2.92 |
0.57 |
3.48 |
10.00 |
35% |
35% (DT) |
|||
| UT22-3-014 | 2.50 |
0.47 |
2.97 |
7.00 |
42% |
58% (DT) |
|||
| UT22-3-015 | 33.08 |
7.80 | 40.88 |
50.00 |
82%(P4) |
94% |
100% |
100% |
|
| UT22-3-016 | 11.11 |
9.52 |
20.63 |
32.50 |
63%(P4) |
100% |
84% |
||
| HET22-3-100 | 85.40 |
27.45 |
112.85 |
160.00 | 70.53% |
71% |
|||
| HET22-3-203 | 2.33 |
0.53 |
2.87 |
6.00 |
48% |
83% |
80% |
0% (DT) |
0% (DT) |
| HET22-3-300 | 16.01 |
3.75 |
19.76 |
20.00 |
99% |
100% |
100% |
100% |
|
| UT22-3-008 +PSU22-3-008 |
41.24 |
8.73 |
49.97 |
58.00 |
86%(P4) |
100% |
88% |
100% |
|
| Program Completion Rates (sci only, removing NT/HC/SI/TD) |
|||
|---|---|---|---|
| Priority | Average Completion | Median Completion | |
| P0 | 94.1% | 100% | |
| P1 | 88.7% | 100% | |
| P2 | 81.4% | 95% | |
| P3 | 71.5% | 84% | |
| hours allocated |
hours charged |
|
| P0 |
33.63 |
31.84 (94.7%) |
| P1 |
105.15 |
93.18 (88.6%) |
| P2 |
140.35 |
113.09 (80.6%) |
| P3 |
135.40 |
111.55 (82.4%) |
Below we show how the TAC allocations were
determined.
| quantity |
Aug (hrs) |
Sep (hrs) |
Oct (hrs) |
Nov (hrs) |
Total (hrs) |
| 18deg-18deg |
243.93 |
268.10 |
306.58 |
318.17 |
1136.78 |
| Weather loss frac. | 0.44 |
0.48 |
0.36 |
0.37 |
|
| Efficiency loss frac. (align+PRs) |
0.08 |
0.07 |
0.07 |
0.07 |
|
| "Clear science" time |
125.67 |
129.65 |
182.48 |
186.41 |
624.22 |
| Com/Eng/GTO time (estimated) |
209.00 |
||||
| "Allowed" hours given to TACs for science |
415.22 |
| Partner |
Share |
Time deficit correction |
Notes |
Total hours allowed |
| Goettingen |
0.03860 |
-0.45 |
15.58 |
|
| Munich |
0.05724 |
+5.79 |
29.56 |
|
| PSU |
0.24897 |
-6.57 |
96.81 |
|
| UT |
0.65518 |
+1.23 |
-10h TESLA allocation per HET Board |
263.27 |
This is how each institution had
allocated its time by priority:
| Time Allocation by Institution (hours) | |||||||
|---|---|---|---|---|---|---|---|
| Institution | Priority 0 | Priority 1 | Priority 2 | Priority 3 | Priority 4 | Total P0-P3 |
Frac. of allowed |
| Goettingen | 1.30 |
3.90 |
5.20 |
5.20 |
- |
15.60 |
100.1% |
| Munich | 2.50 |
7.30 |
12.50 |
9.90 |
- |
32.20 |
108.9% |
| PSU | 7.33 |
24.10 |
32.30 |
32.30 |
12.41 |
96.03 |
99.2% |
| UT | 22.50 |
69.85 |
90.35 |
88.00 |
75.00 |
270.7 |
102.8% |
| Other allocations | |||||||
| GTO | 166.00 | 10.00 | 9.00 | 1.00 |
- |
186.00 |
100.0% |
Notes:
1) Allocations in joint programs are reported separately for each
partner here
| Accumulated deficits for each partner |
UT |
PSU |
M |
G |
total sci hours |
|
| FY2015-2016 |
+4.6 |
-6.9 |
+1.1 |
+1.2 |
40.49 |
|
| FY2016-2017 |
+22.7 |
-22.8 |
+0.8 |
-0.8 |
439.56 |
|
| FY2017-2018 |
+37.7 |
-21.9 |
-14.7 |
-1.2 |
887.71 |
|
| FY2018-2019 |
+43.0 |
-32.0 |
-10.8 |
-0.2 |
1401.17 |
|
| FY2019-2020 |
+48.9 |
-48.4 |
+0.6 |
-1.1 |
2101.82 |
|
|
FY2020-2021
|
+25.1 |
-37.6 |
+13.8 |
-1.3 |
3095.70 |
|
|
FY2021-2022
|
+1.7 |
-19.0 |
+13.5 |
+3.8 |
4140.40 |
|
| FY2022-2023 (as of 1-Dec) |
+6.6 |
-21.5 |
+10.7 |
+4.2 |
4497.10 |
|
| percent of deficit: |
+0.15% |
-0.48% |
+0.24% |
+0.09% |
Below are the summaries of the Guaranteed Time Observations (GTO) programs granted by the Board:
| GTO and Special Time Charged by Project (hours) | |||||
|---|---|---|---|---|---|
| Project | Allocated in 22-3 |
Allocated total to date including 22-3 |
Charged in 22-3 |
Charged total to date including 22-3 |
|
| HETDEX (HETYY-P-100) | 2894.0 | 2704.0 | 112.9 |
2184.3 | |
| LRS2 GTO (HETYY-P-2XX) | 6.0 | 205.9 | 2.9 |
127.4 | |
| HPF GTO (HETYY-P-3XX) | 20.0 | 260.4 | 19.8 |
261.1 | |
| GW (HETYY-P-400) | 0.0 | 70.0 |
0.0 |
12.4 | |
(Totals to date start from the 11-2 period)
Significant time losses to problems during the trimester
The following are our most significant problems in terms of
their time lost, keeping those with >60min lost:
| Lifetime science time lost hh:mm |
PR # |
Brief description |
| 04:43 |
6027 6097 |
SAMS -384 issues, electronics/sensor related |
| 04:00 |
4239 |
DMI returning 9999, fiber cleaned and
replaced |
| 02:43 |
4683 5685 |
"Failed to send point to TMCS" or "TMCS lost
trajectory" errors |
| 02:09 |
6096 |
Tracker oscillation; loose 1 second pulse
cable |
| 02:08 |
6100 |
GPS time stamp corruption results in tracker
hitting soft limits and small skew |
| 01:28 |
5364 6080 |
probe move timeouts and other issues |
| 01:26 |
6074 |
HPF TIMS client crash, loss of metadata |
| 01:18 |
4776 |
Dome stops at wrong position |
| 01:09 |
6120 |
DSpace issue, replaced DS1005 board |
SJ, 13 Dec 2022