graphs
Verifying and removing systematic trends from metrology data
used in sky quality statistics
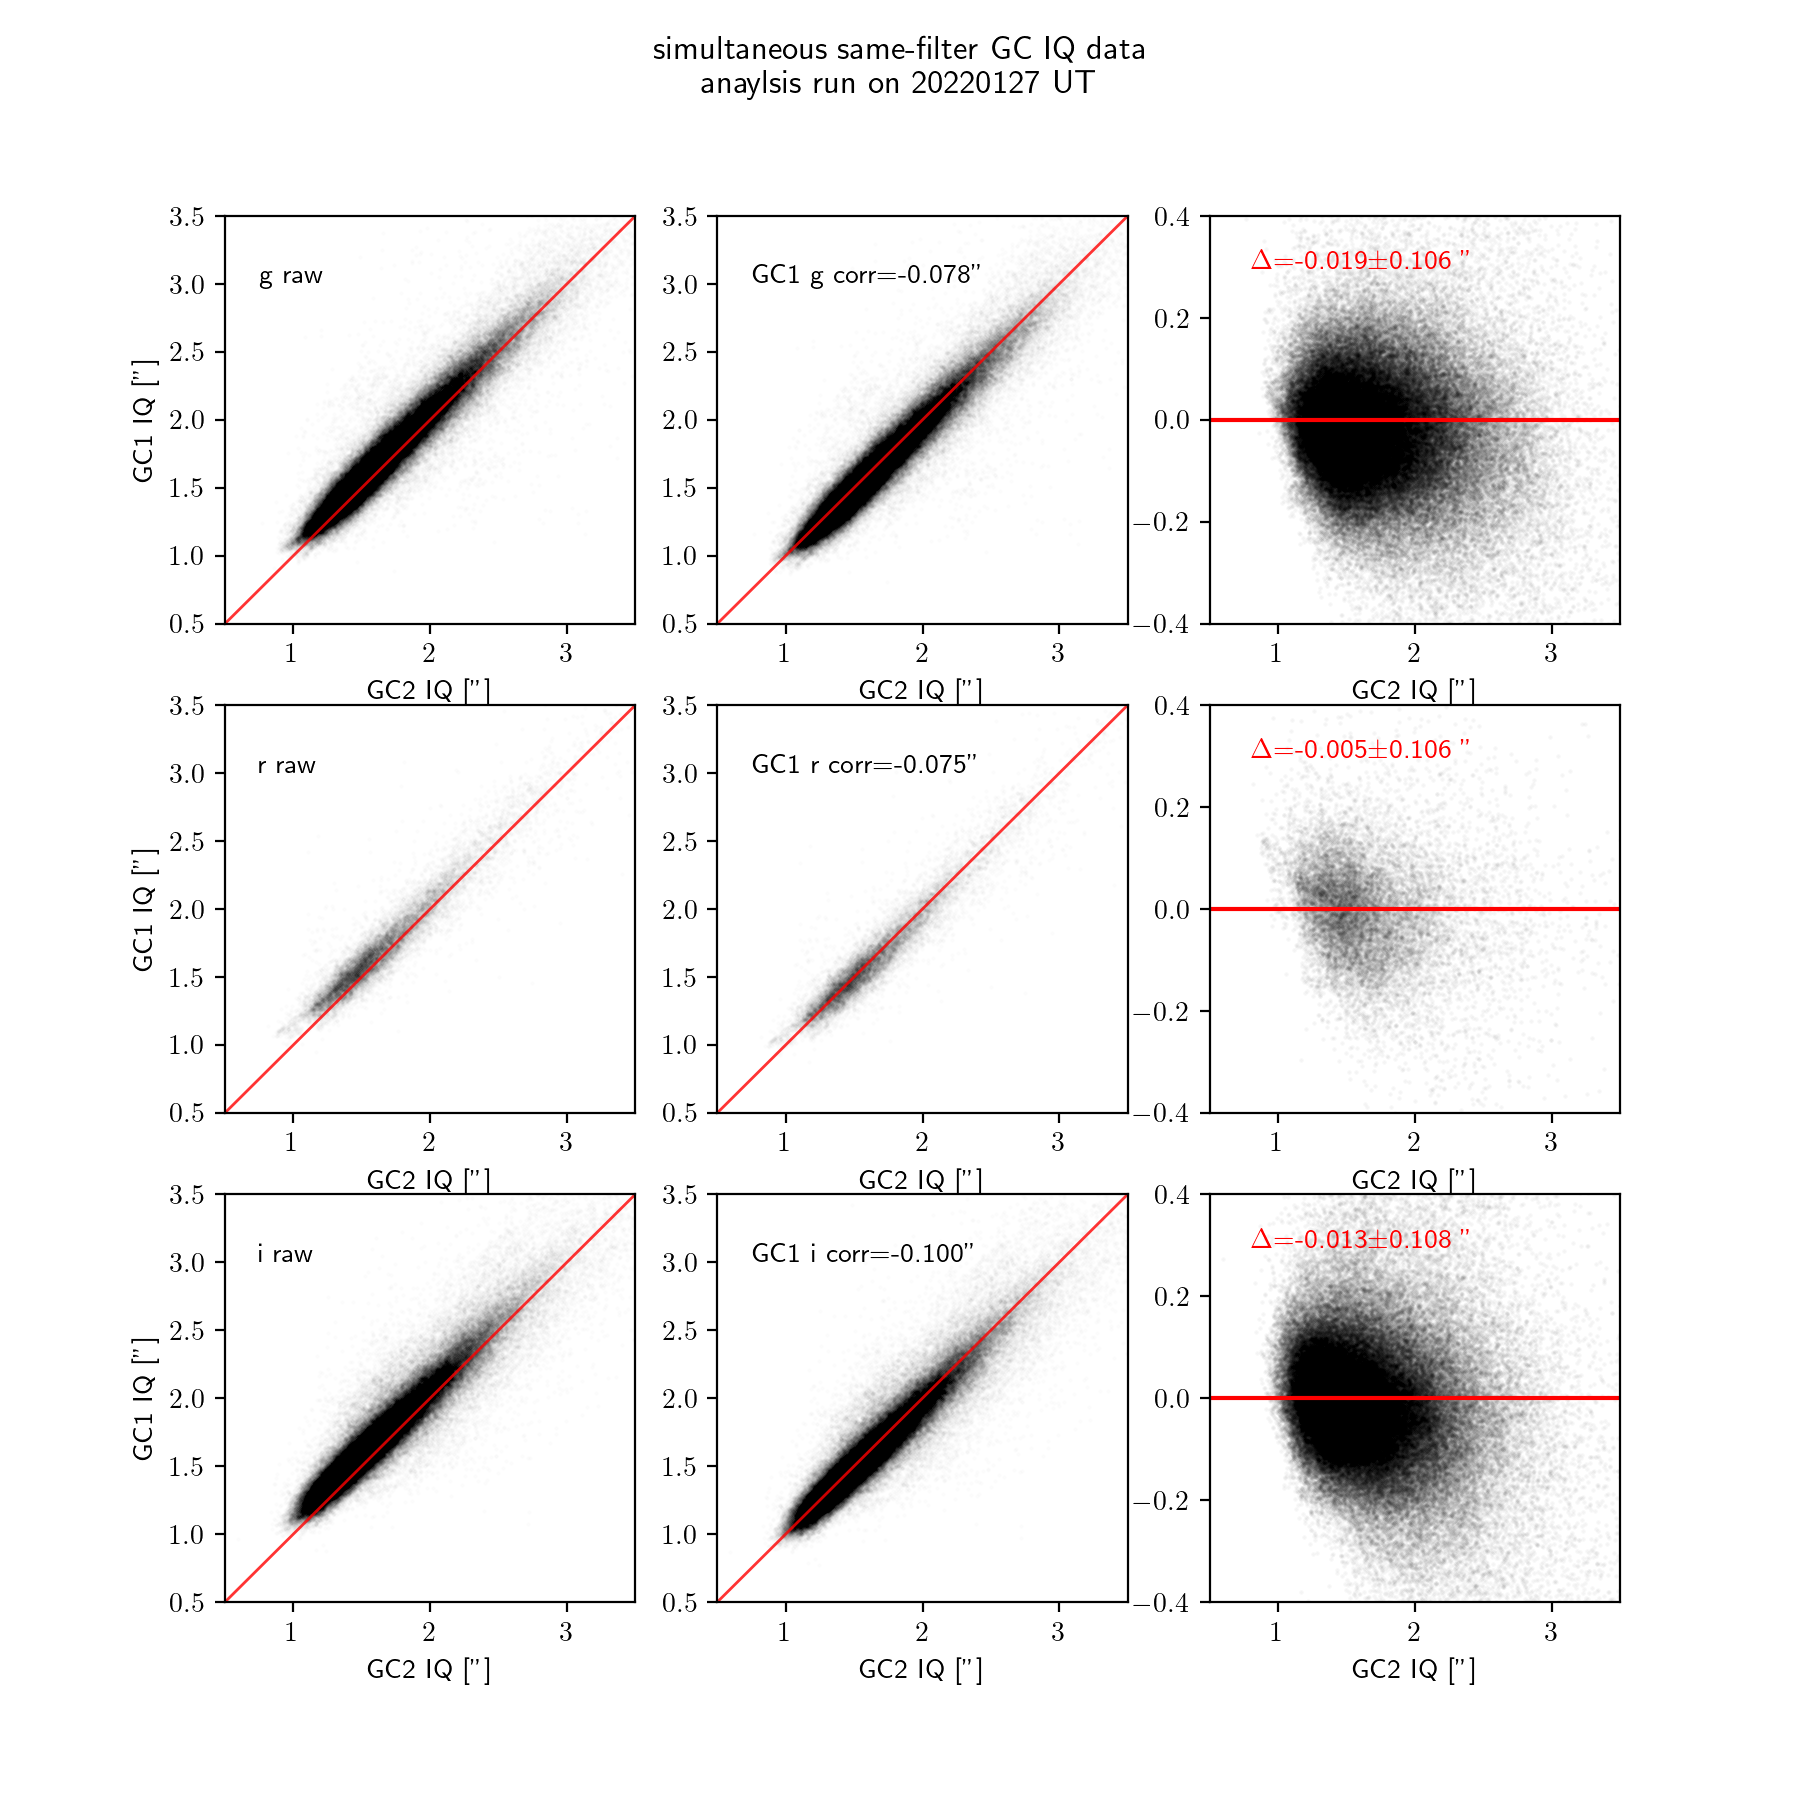
First, we compare Guider Camera Image Quality (IQ, FWHM) between
both cameras (GC1 and GC2) and all three filters (g`, r`, i`):
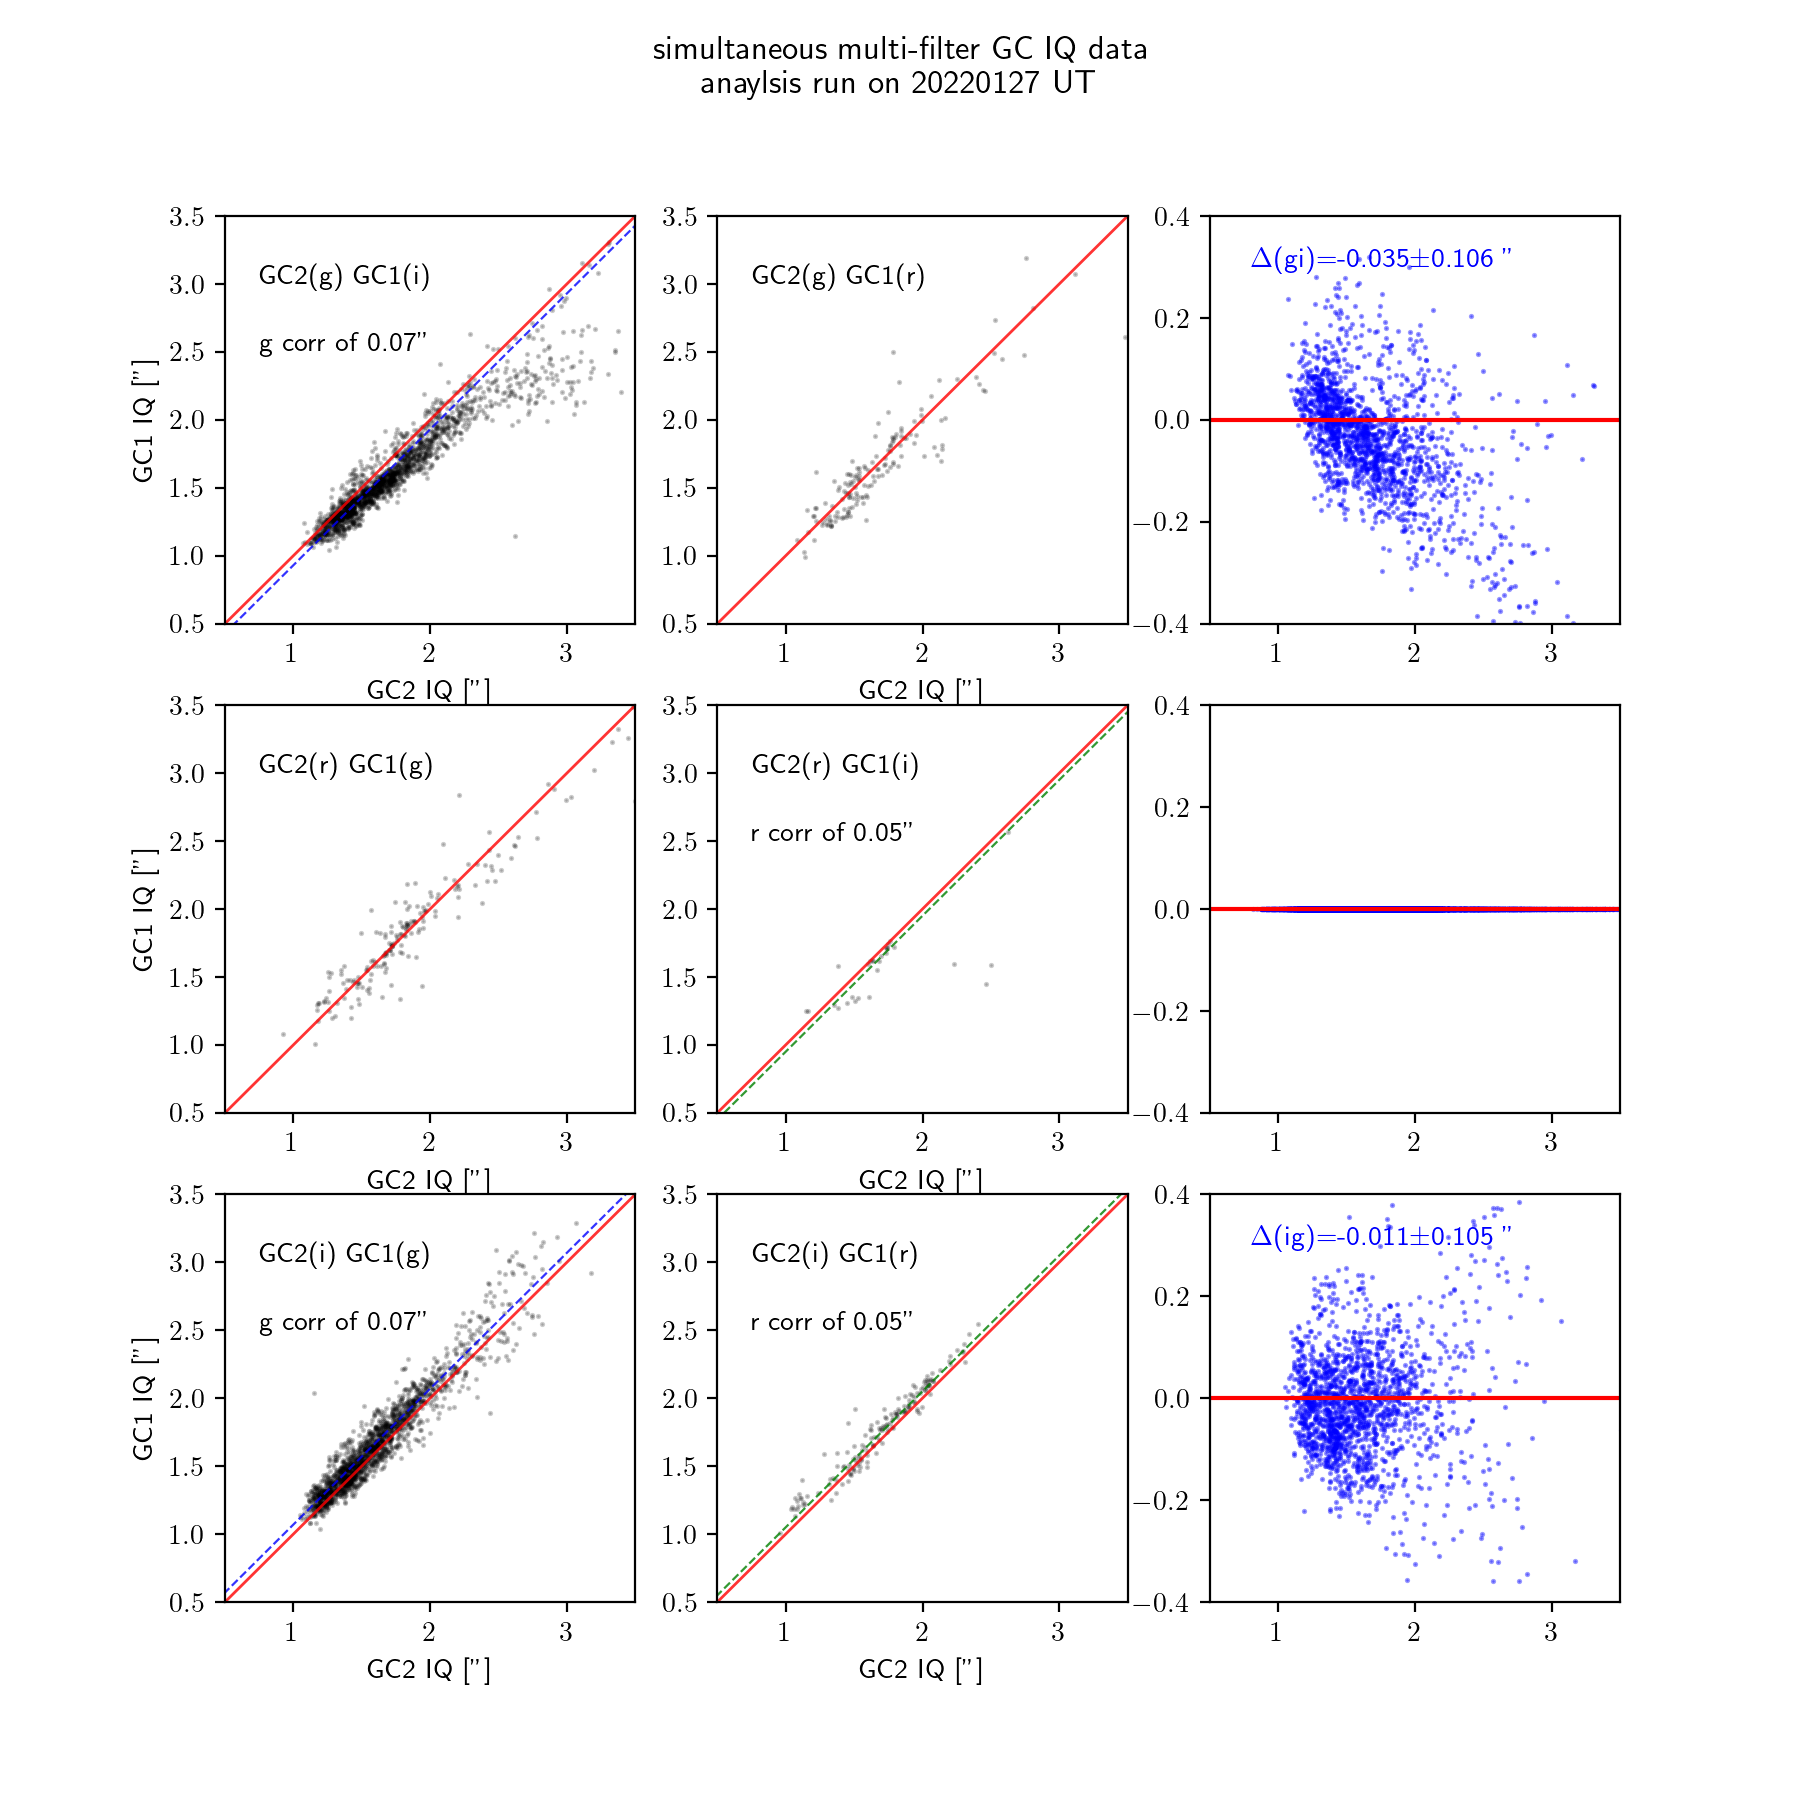
It seems that the i` filter on GC2 gives the lowest IQ values
overall; all other filters and GC1 values are re-scaled to match
GC2(i`).
Conversion relations are shown on the graphs above, in two steps.
Left panel: same-filter comparison, answering the question "how
well-matched is GC1(g) and GC2(g)?" and same for r and i, with
simultaneous observations
In order to make GC1 IQ match GC2 IQ in each
filter, these corrections are necessary:
GC1(g) - 0.078"
GC1(r) - 0.075"
GC1(i) - 0.100"
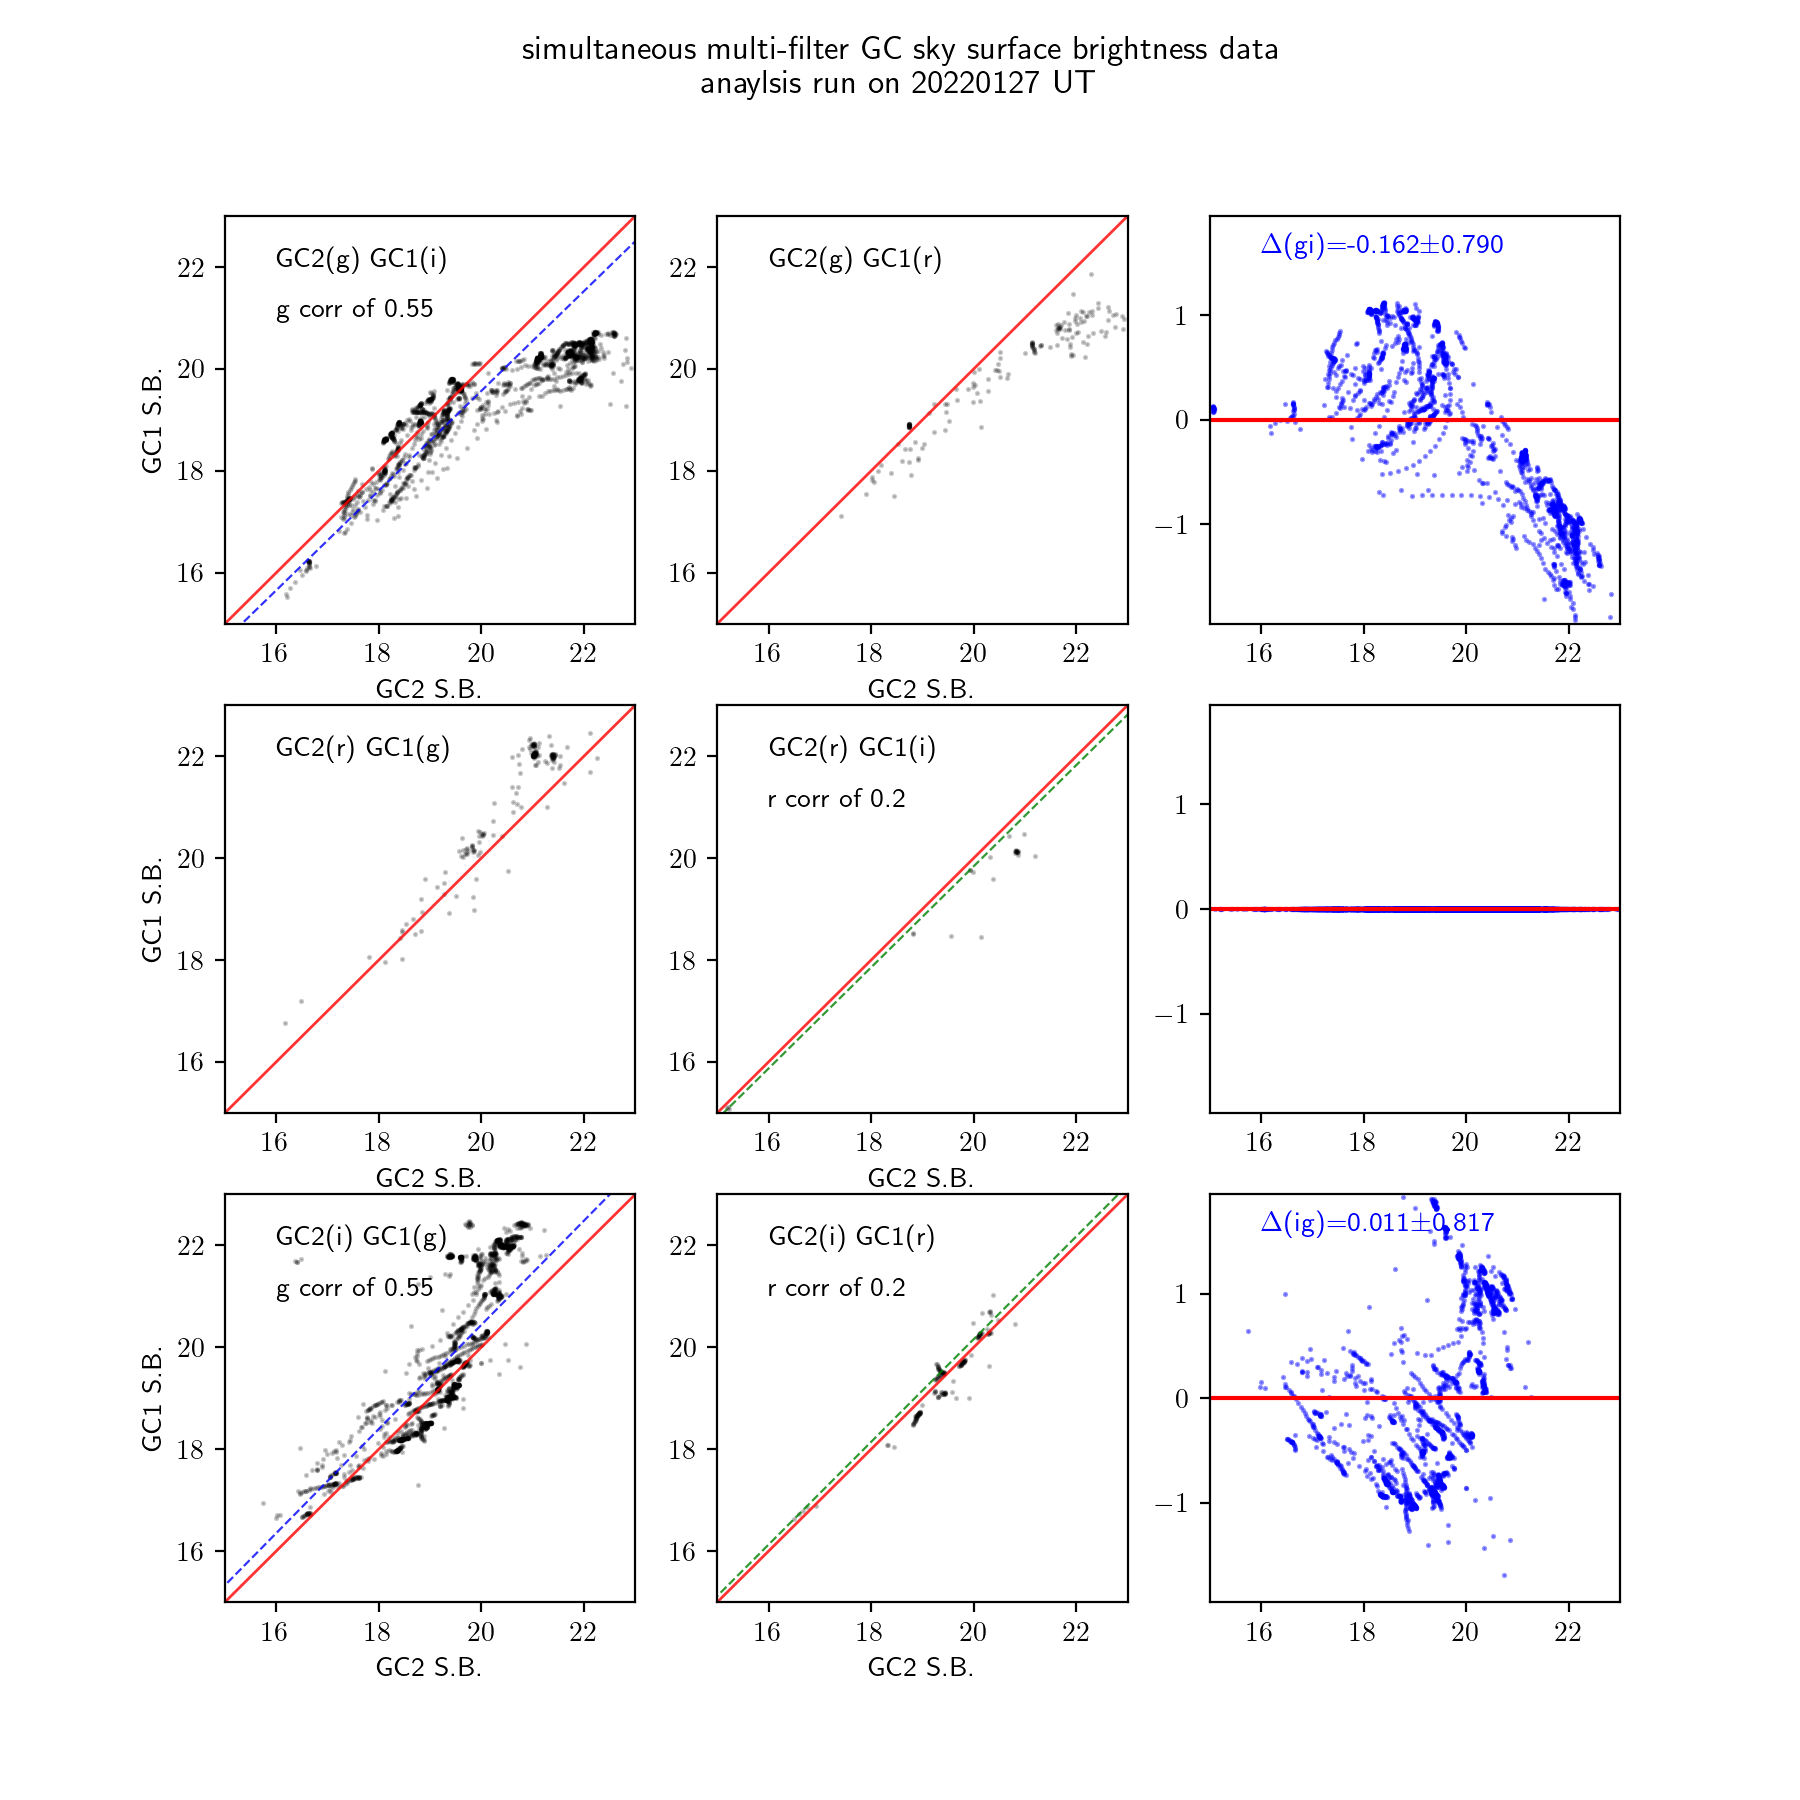
Right panel: multi-filter comparison, answering the question "how
well-matched is GC1(g) and GC2(i)" with simultaneous observations.
This required coordination with the Telescope Operators to manually
change the filter of the inactive guider camera in order to collect
simultaneous multi-filter data during science operations.
In order to make all filters/cameras match with
GC2(i`), these corrections are required:
IQ(g) - 0.07"
(applied to both guiders)
IQ(r) - 0.05"
(applied to both guiders)
After having made these corrections we find typical scatter
(standard deviations) about the unity lines of 0.1", which is a
lower limit on the uncertainty of these IQ estimates.
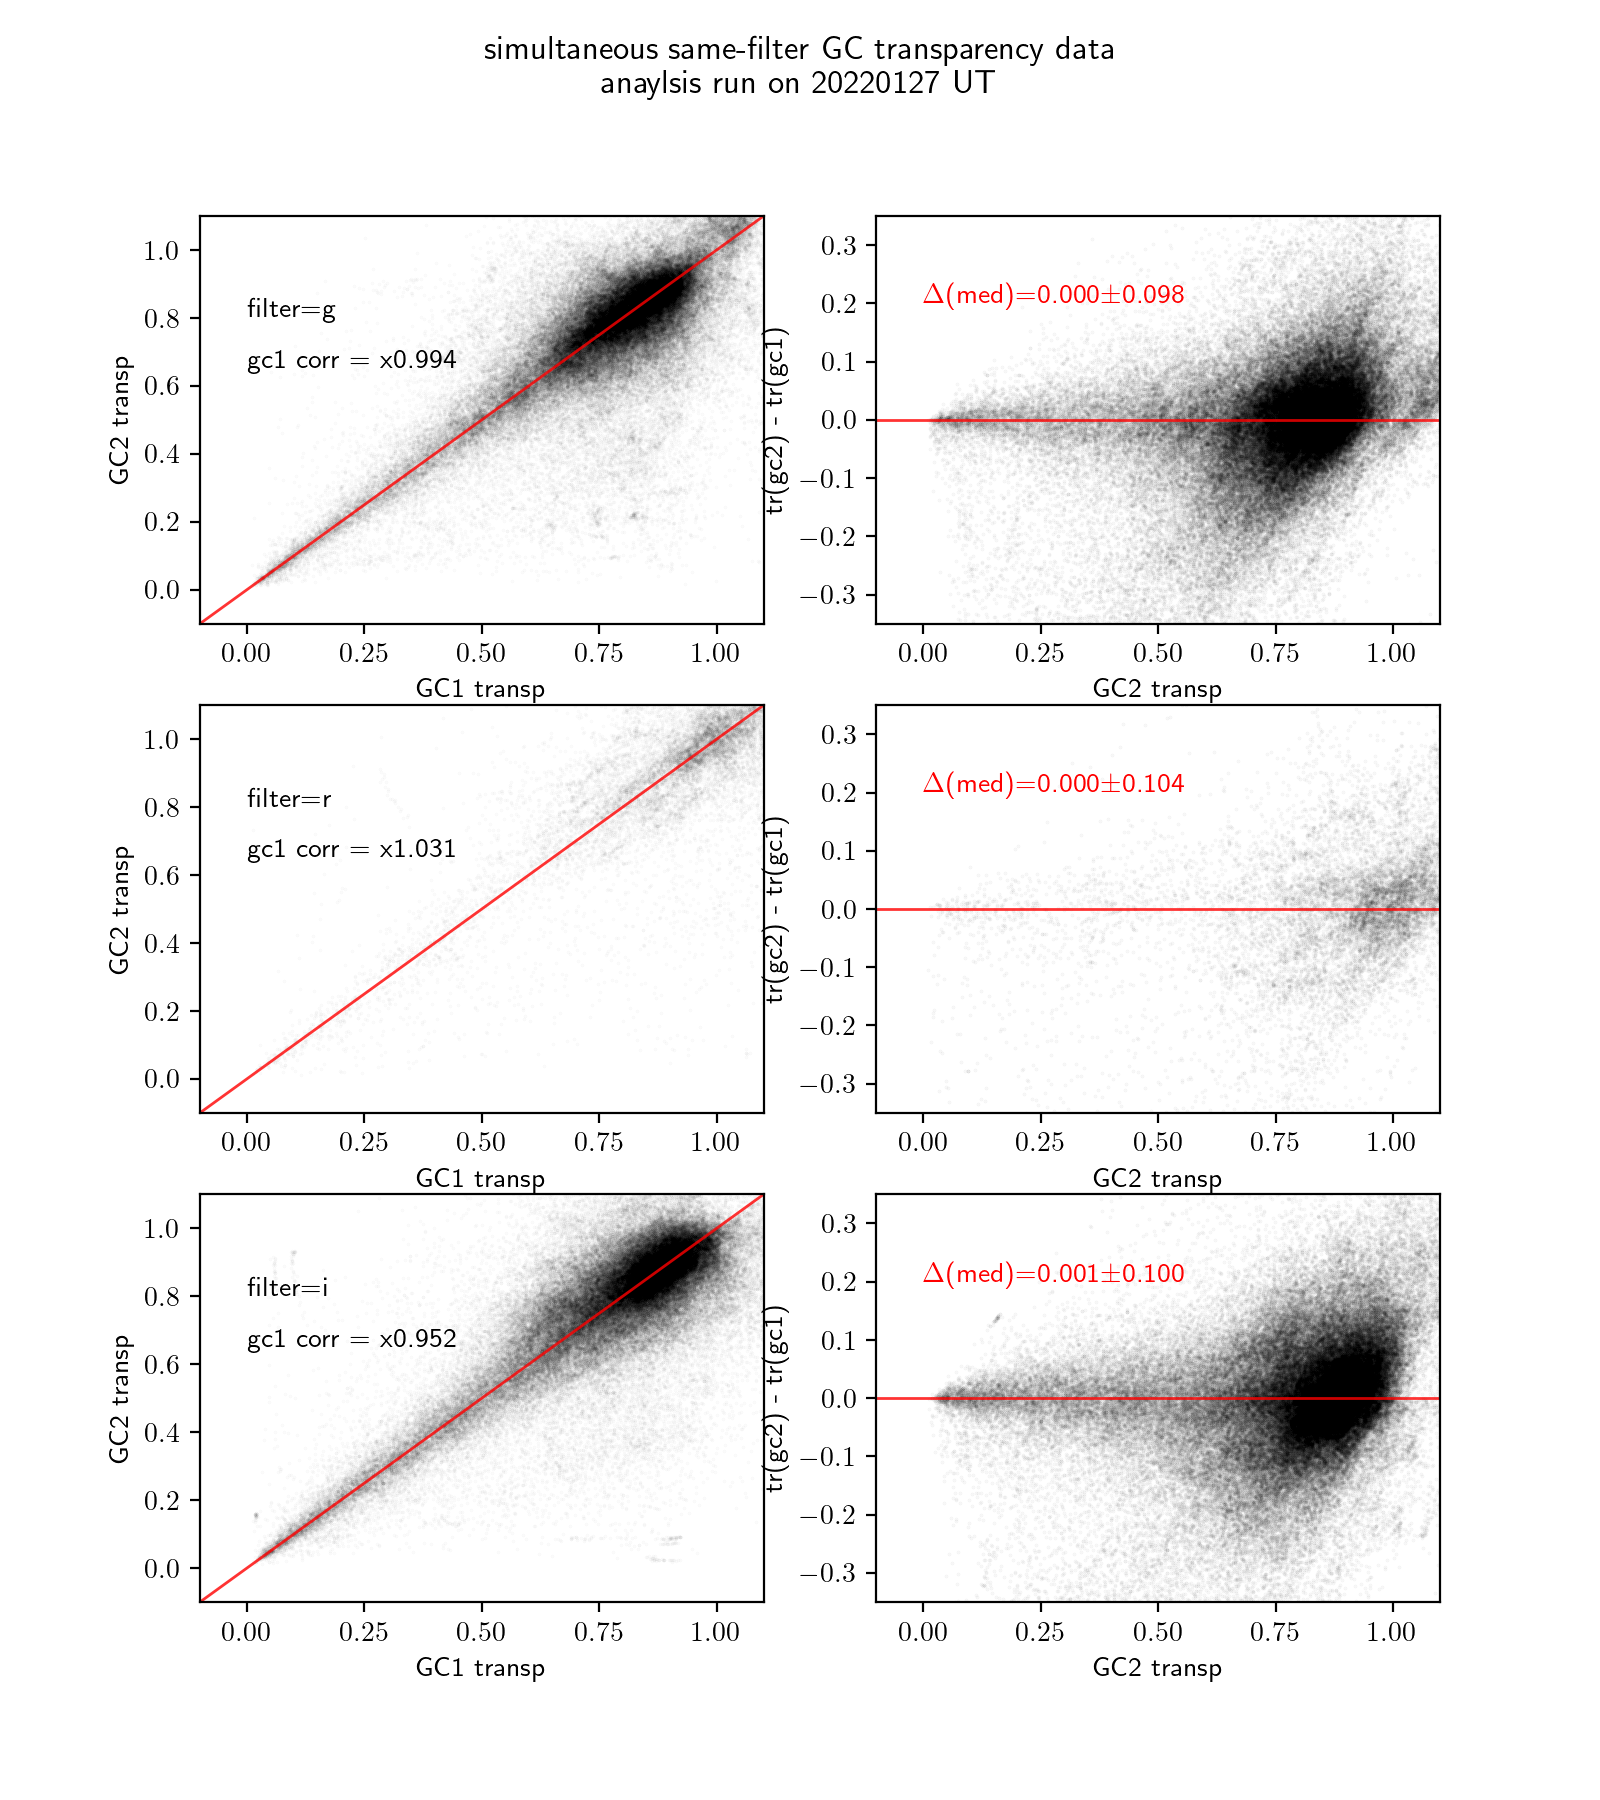
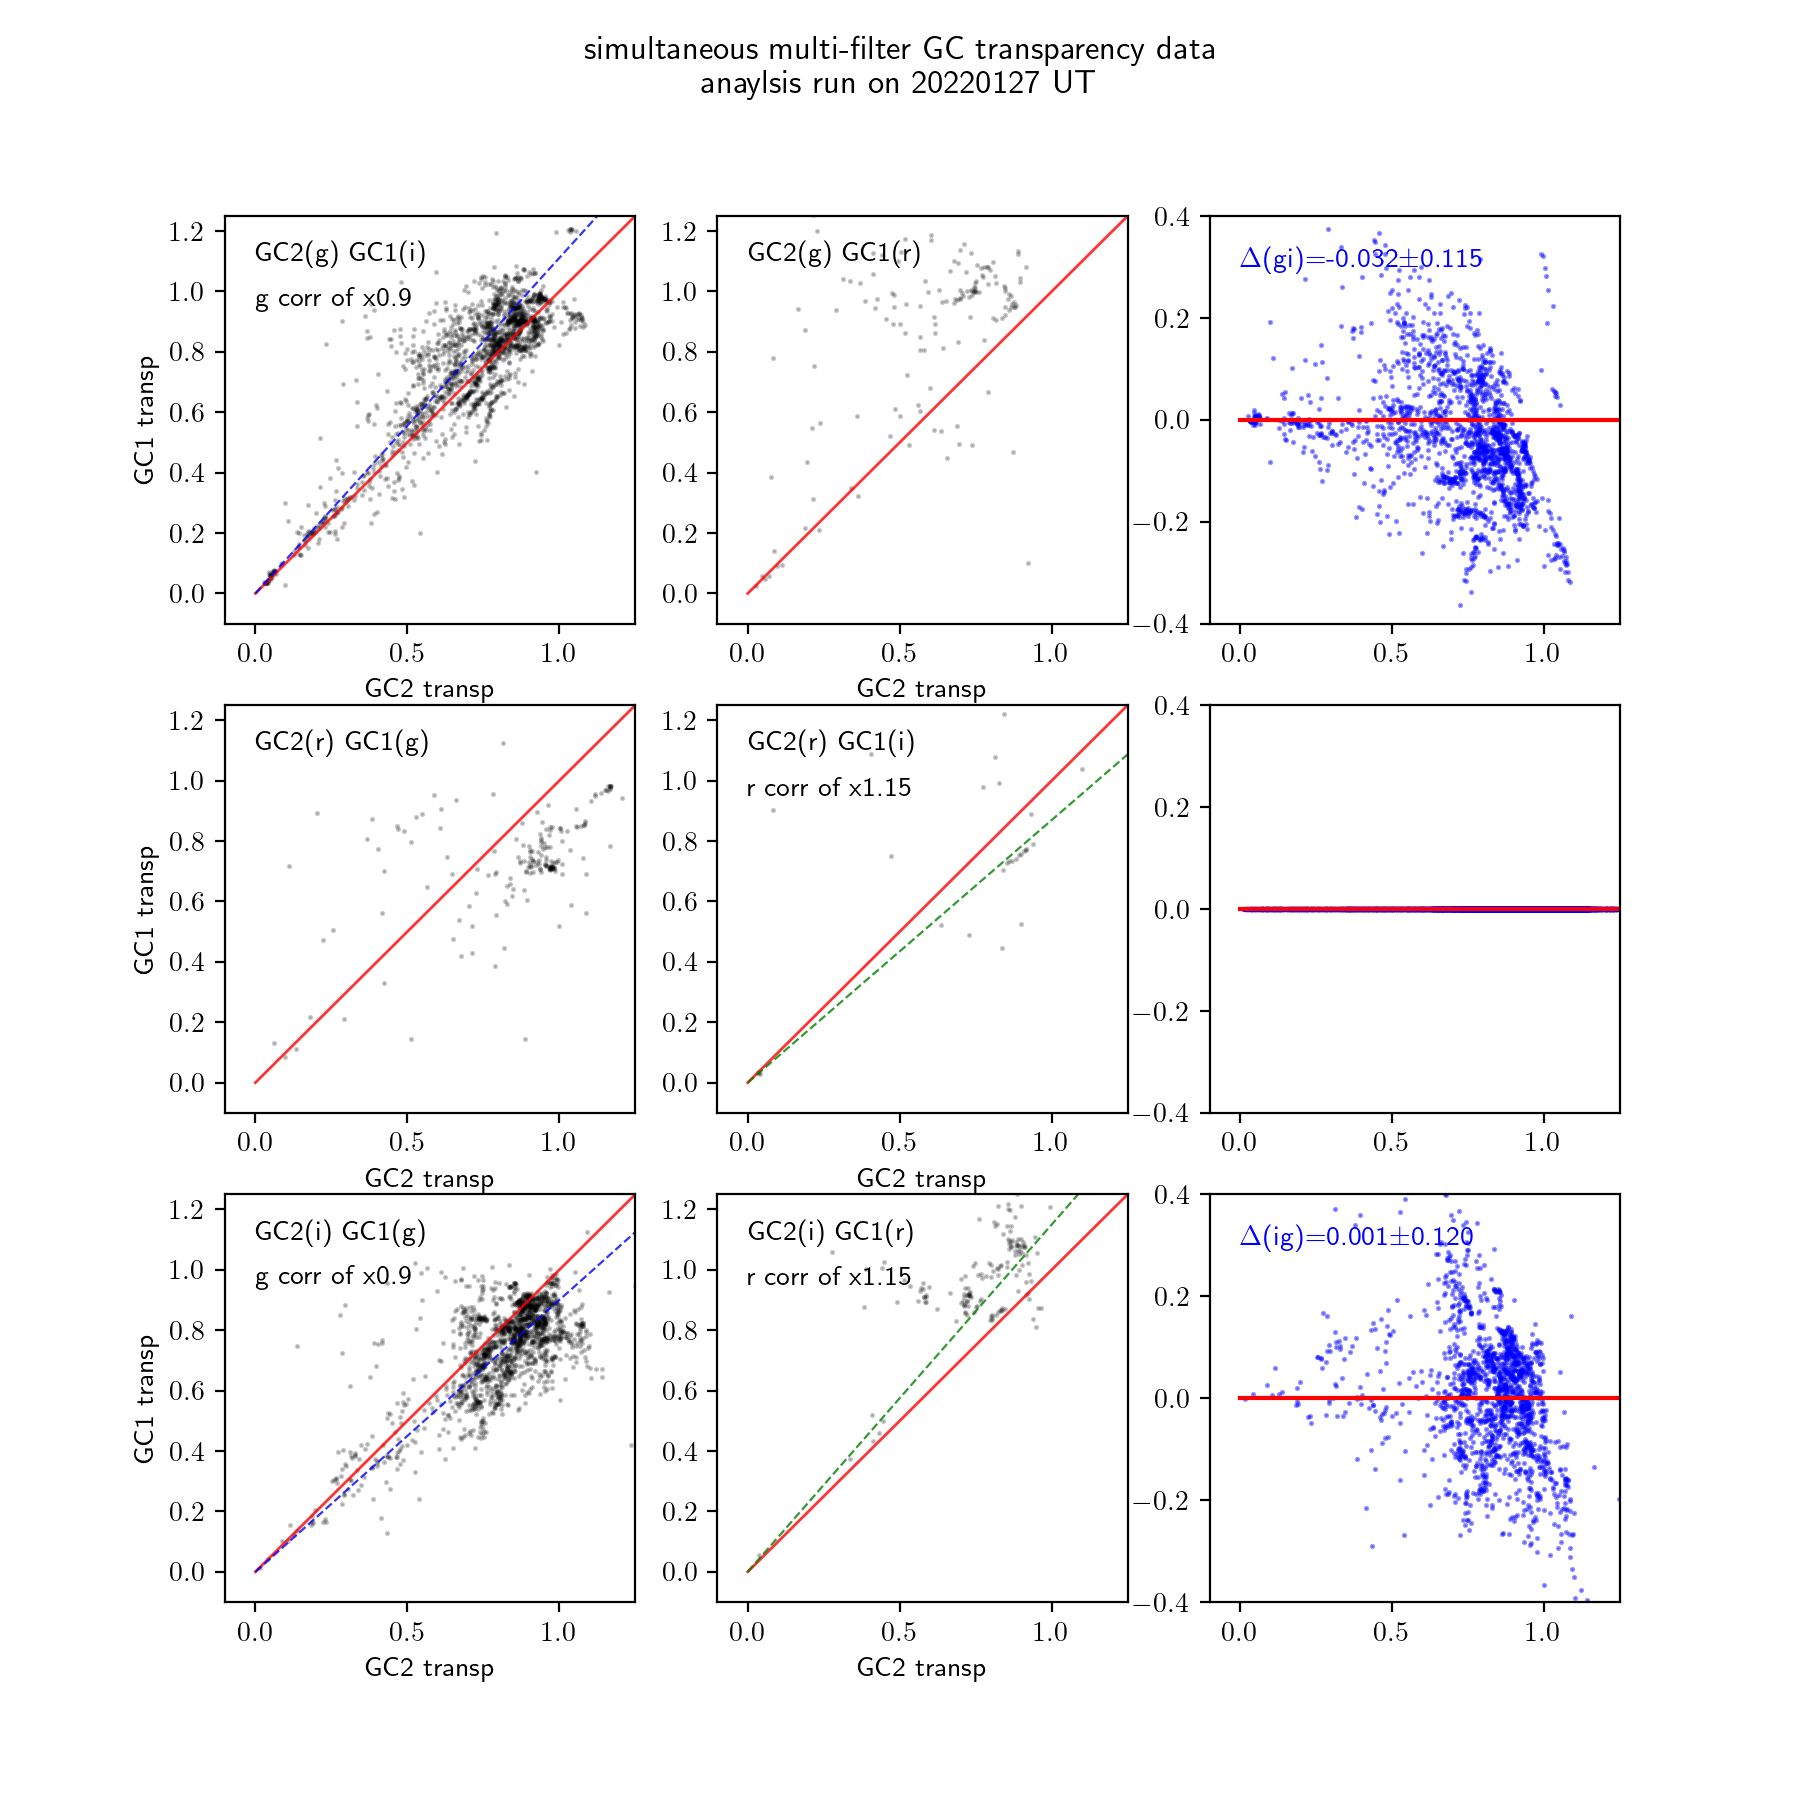
Likewise we convert transparency between the two cameras and between
all three filters, with corrections indicated on the graphs above.
Typical scatter is 0.10-0.12% which is a good uncertainty estimate.
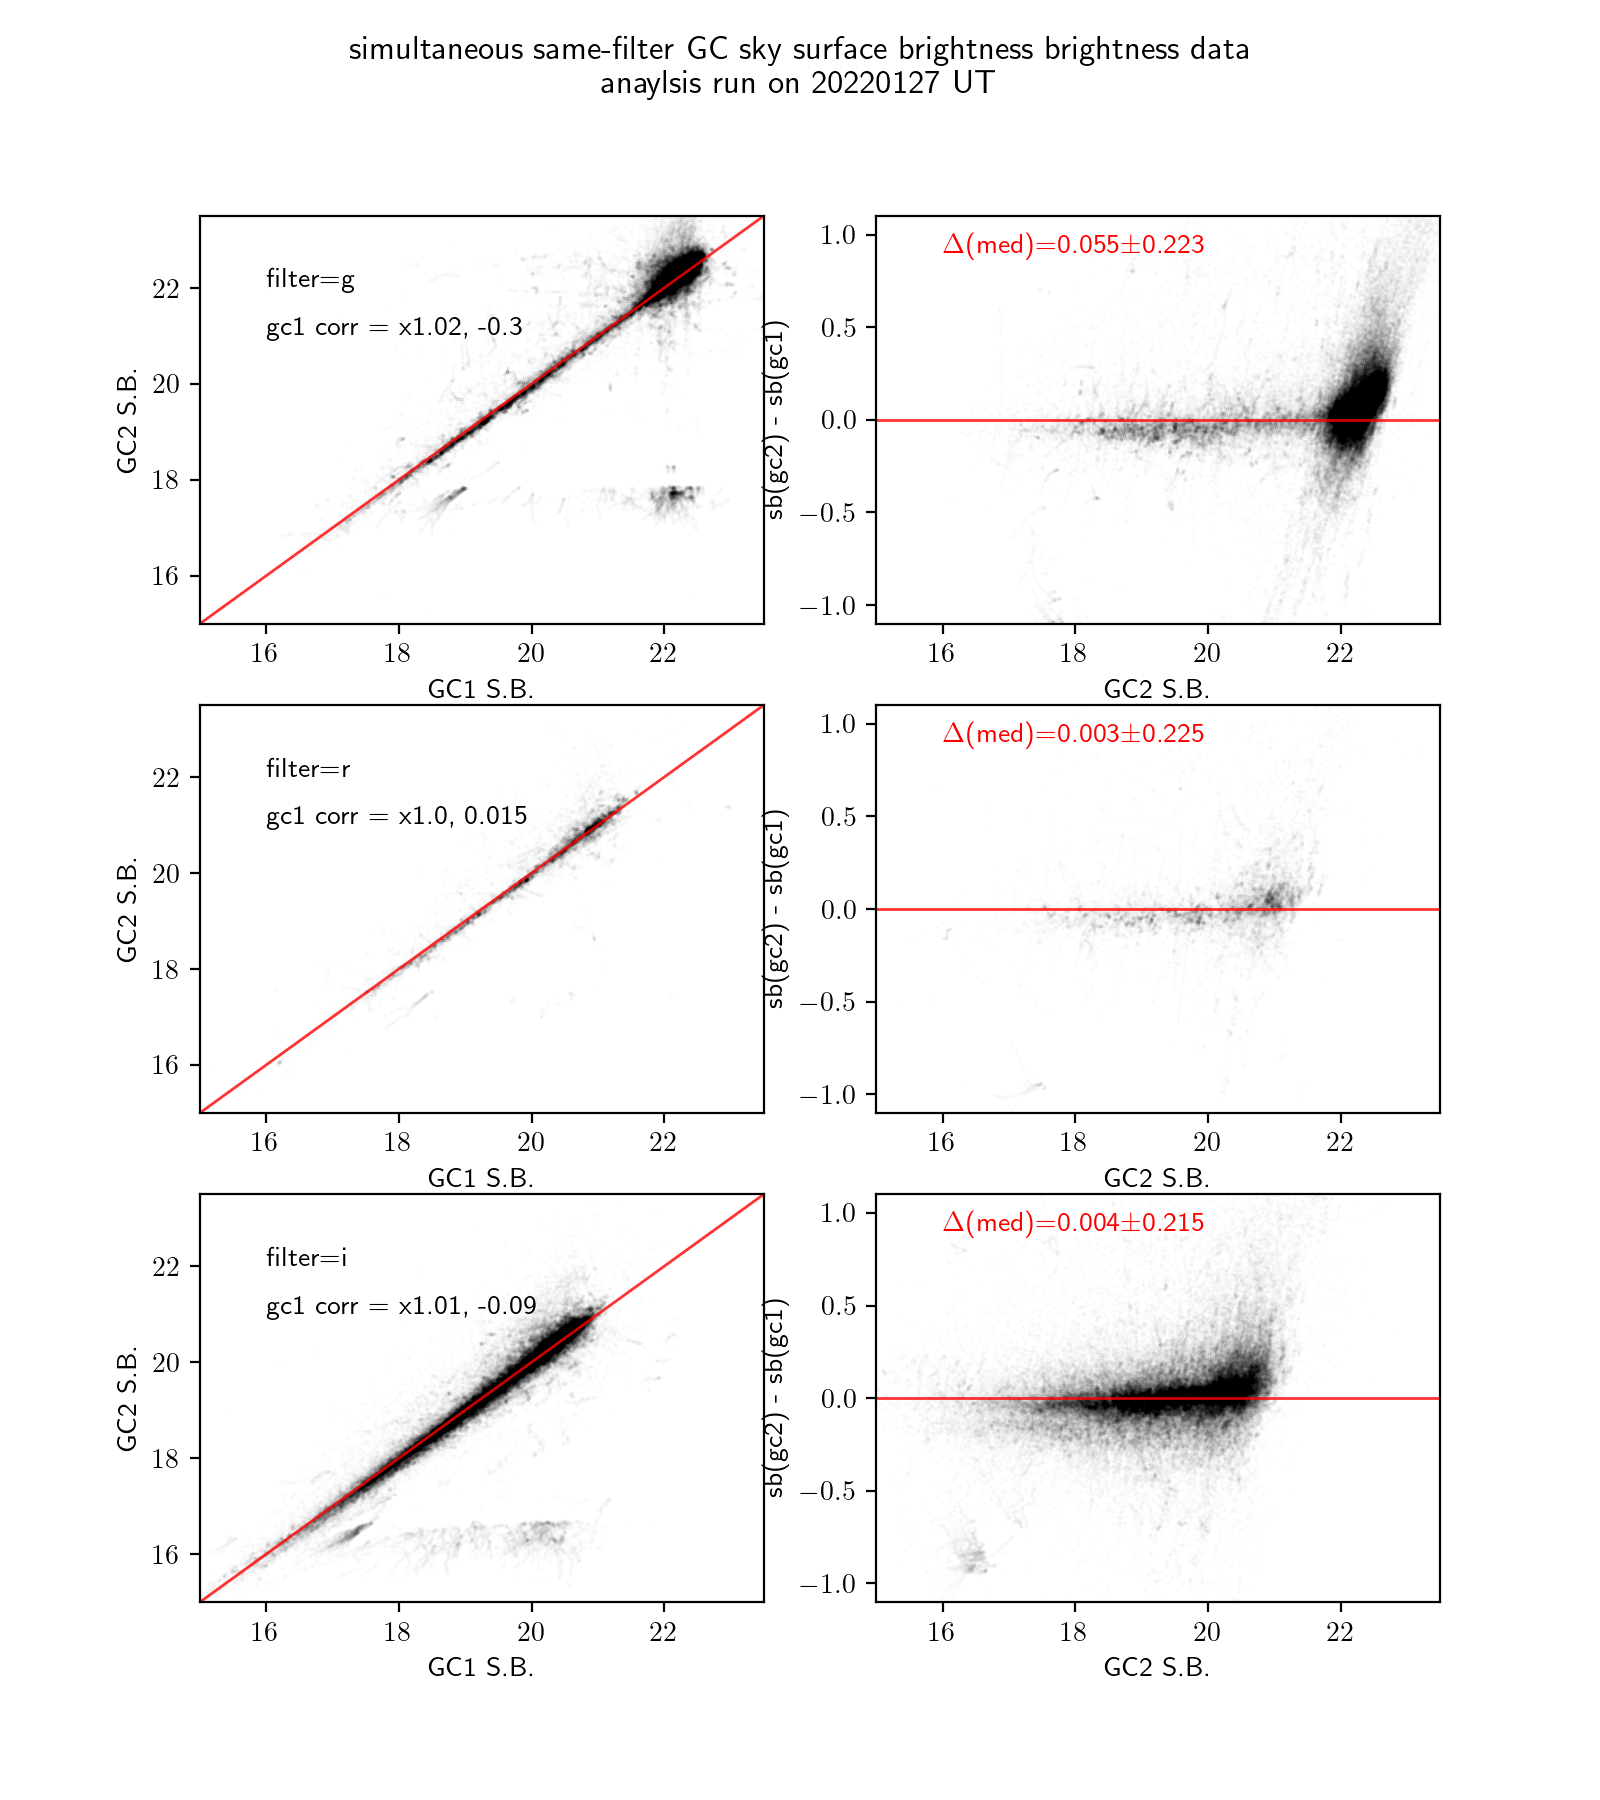
Likewise we convert sky surface brightness between the two cameras
and between all three filters, with corrections indicated on the
graphs above. Typical scatter is 0.2-0.5 mag/arcsec2, which is
somewhat larger than we'd like, but is related to the relatively
small imaging area of the guider cameras and the loose constraints
they give on sky surface brightness.
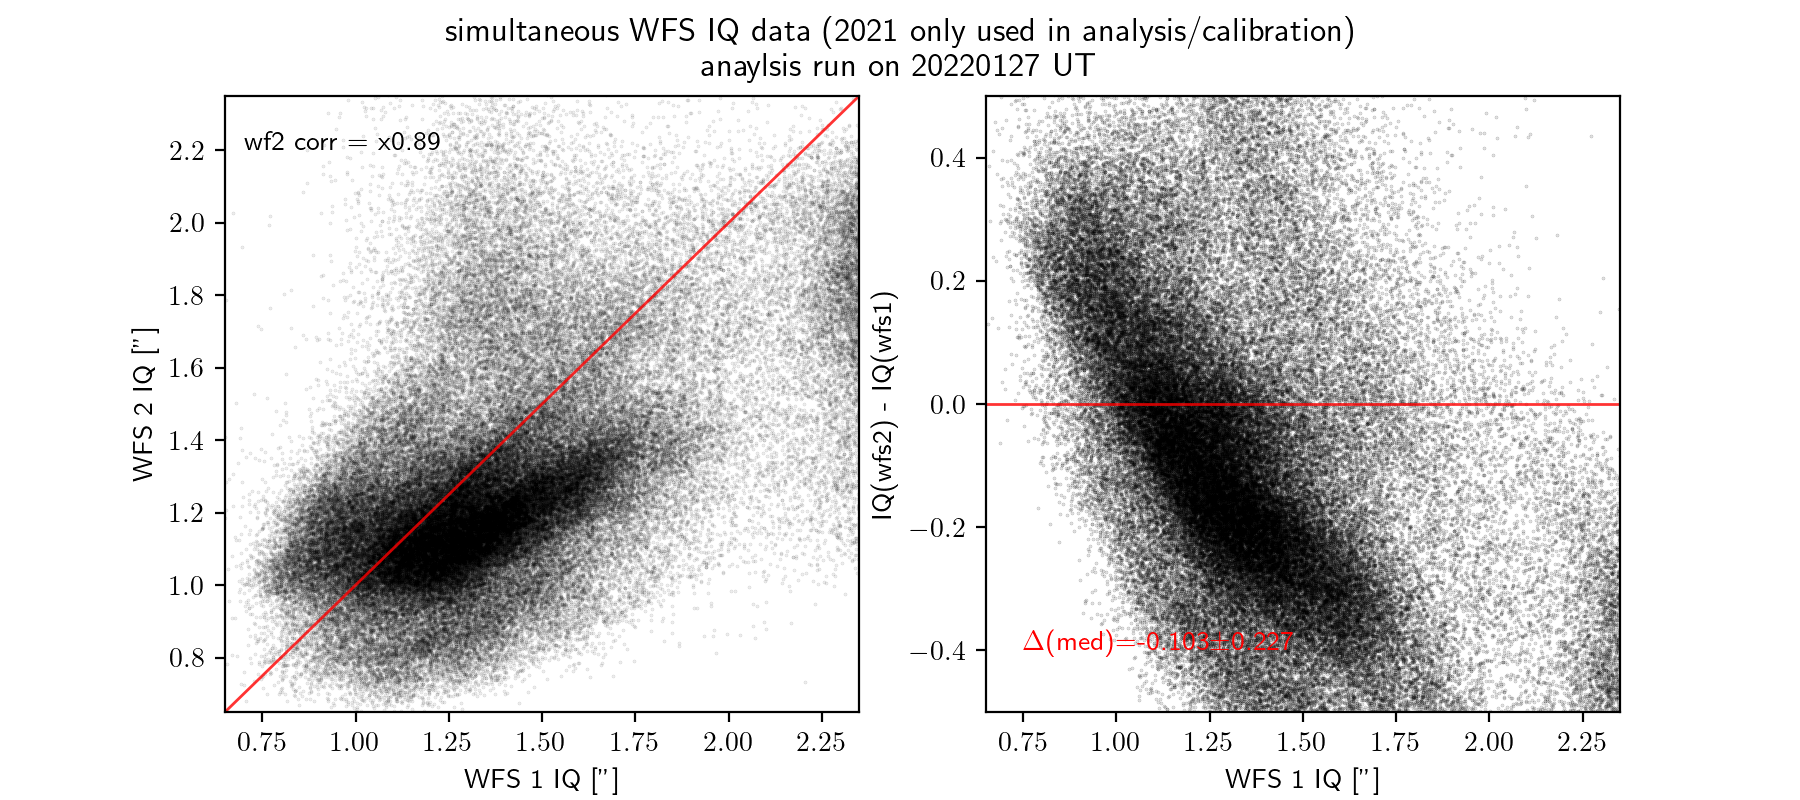
Lastly we also remove the systematic trend between the two wavefront
sensors - in general WFS2 gives larger IQ values than WFS1 and has
to be scaled down by 89% to match up. The matching is not great, but
it's all we've got.
These verification plots were generated in Jan 2022 using 2021 data
when all probes were functioning. This type of verification and
systematic detrending should probably be done periodically in the
future, as well.
Last updated 28 Jan 2022 - SJ.
Last updated: Thu, 23 May 2024 15:21:16 +0000 sir

|
|
|